

Answered step by step
Verified Expert Solution
Question
1 Approved Answer
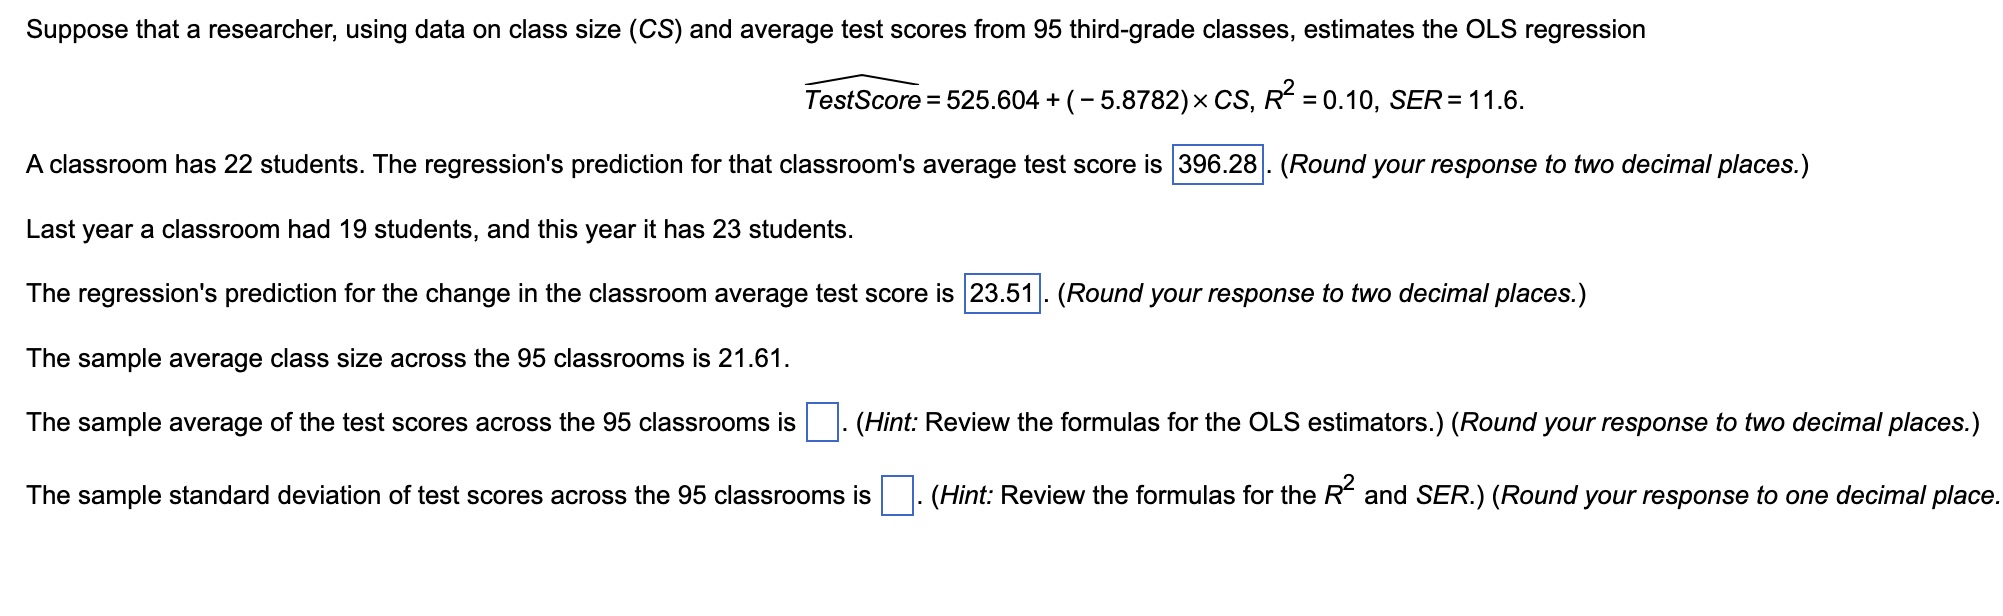
Suppose that a researcher, using data on class size (CS) and average test scores from 95 thirdgrade classes, estimates the OLS regression A TesiScore =

Step by Step Solution
There are 3 Steps involved in it
Step: 1

Get Instant Access to Expert-Tailored Solutions
See step-by-step solutions with expert insights and AI powered tools for academic success
Step: 2

Step: 3
Ace Your Homework with AI
Get the answers you need in no time with our AI-driven, step-by-step assistance
Get Started
Elementary Number Theory
Authors: Charles Vanden Eynden
2nd Edition
1478639113, 9781478639114