

Answered step by step
Verified Expert Solution
Question
1 Approved Answer
Suppose that a student uses data on pulse rates collected from a random sample of 100 students from her college, and finds a 95% confidence
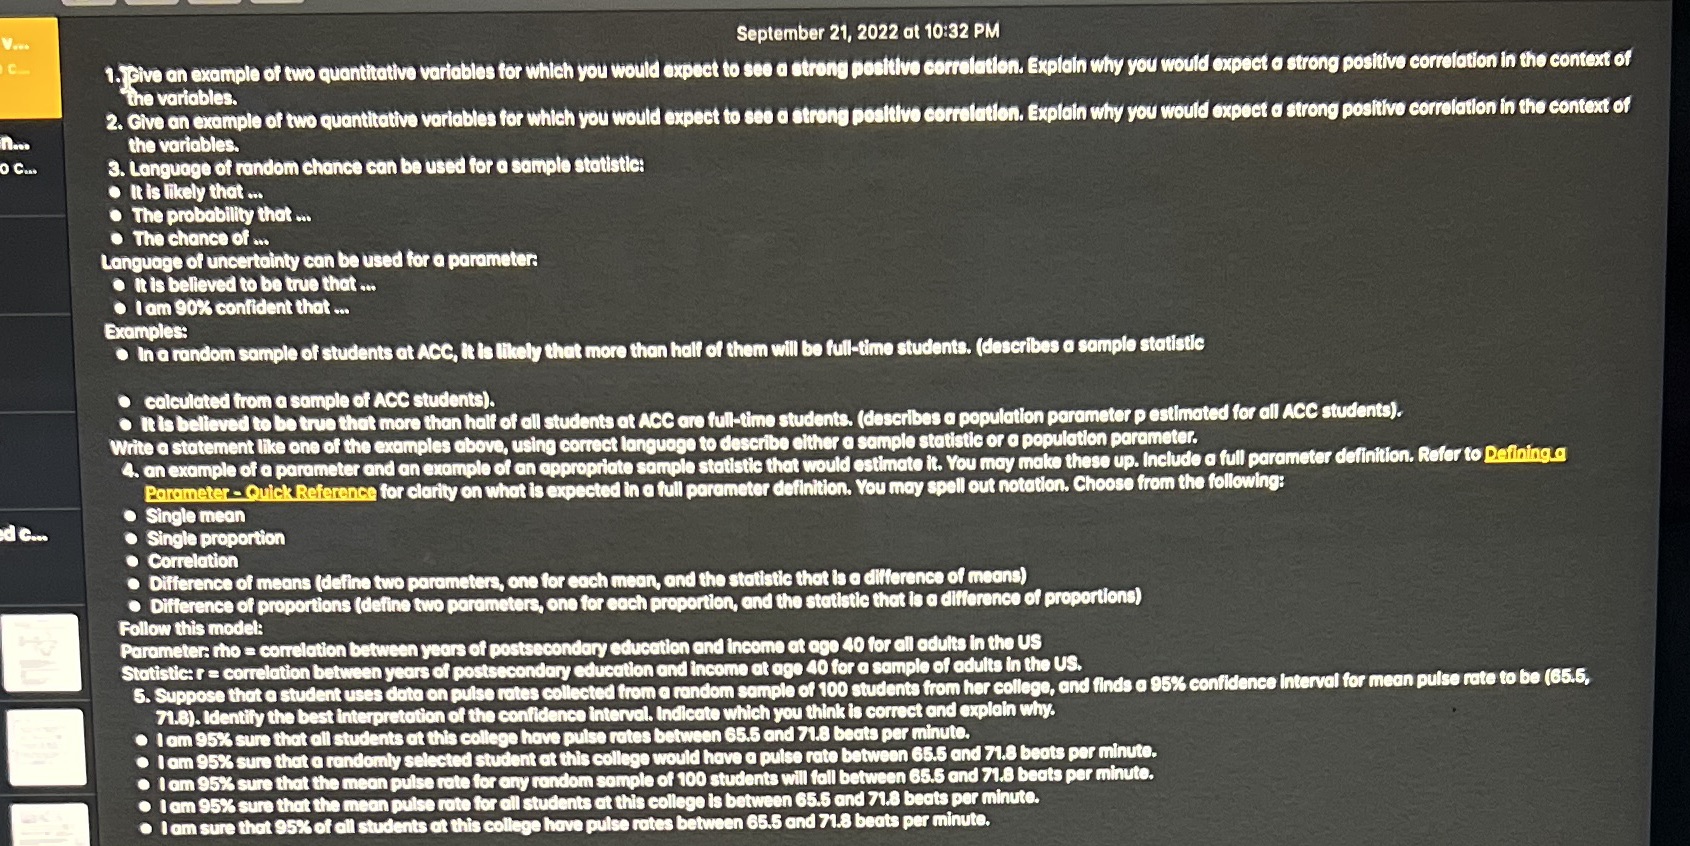
- Suppose that a student uses data on pulse rates collected from a random sample of 100 students from her college, and finds a 95% confidence interval for mean pulse rate to be (65.5, 71.8). Identify the best interpretation of the confidence interval. Indicate which you think is correct and explain why.
- I am 95% sure that all students at this college have pulse rates between 65.5 and 71.8 beats per minute.
- I am 95% sure that a randomly selected student at this college would have a pulse rate between 65.5 and 71.8 beats per minute.
- I am 95% sure that the mean pulse rate for any random sample of 100 students will fall between 65.5 and 71.8 beats per minute.
- I am 95% sure that the mean pulse rate for all students at this college is between 65.5 and 71.8 beats per minute.
- I am sure that 95% of all students at this college have pulse rates between 65.5 and 71.8 beats per minute.
Step by Step Solution
There are 3 Steps involved in it
Step: 1

Get Instant Access to Expert-Tailored Solutions
See step-by-step solutions with expert insights and AI powered tools for academic success
Step: 2

Step: 3
Ace Your Homework with AI
Get the answers you need in no time with our AI-driven, step-by-step assistance
Get Started
Trigonometry
Authors: Mark Dugopolski
3rd Edition
0321899830, 9780321899835