Answered step by step
Verified Expert Solution
Question
1 Approved Answer
Suppose that a teacher wants to see how the number of absences a student in her class has affects the students final grade. The

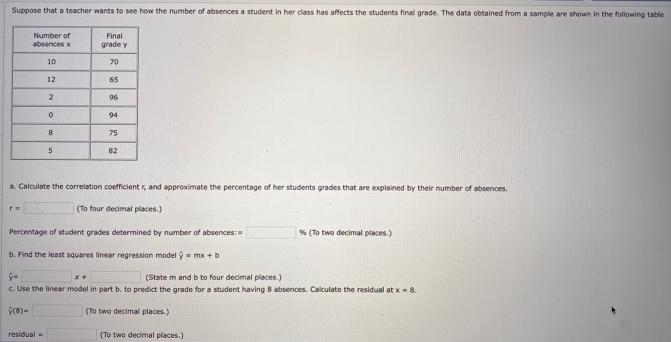
Suppose that a teacher wants to see how the number of absences a student in her class has affects the students final grade. The data obtained from a sample are shown in the following table Number of absences x 10 Final grade y 70 12 65 2 96 94 8 75 5 82 a. Calculate the correlation coefficient r, and approximate the percentage of her students grades that are explained by their number of absences. (To four decimal places.) Percentage of student grades determined by number of absences:= % (To two decimal places.) b. Find the least squares linear regression model =mx+b (State m and b to four decimal places.) c. Use the linear model in part b. to predict the grade for a student having 8 absences. Calculate the residual at x = 8. (8)- residual (To two decimal places.) (To two decimal places.)
Step by Step Solution
There are 3 Steps involved in it
Step: 1

Get Instant Access to Expert-Tailored Solutions
See step-by-step solutions with expert insights and AI powered tools for academic success
Step: 2

Step: 3

Ace Your Homework with AI
Get the answers you need in no time with our AI-driven, step-by-step assistance
Get Started


