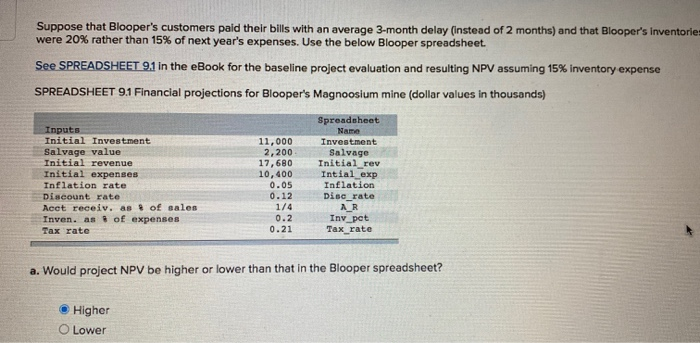
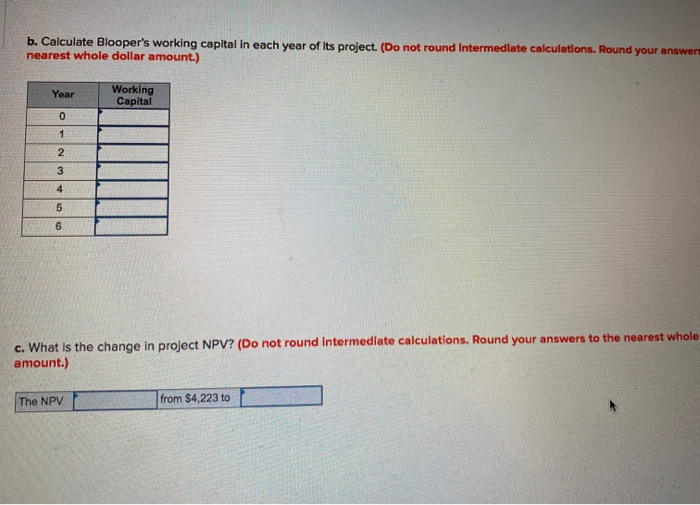
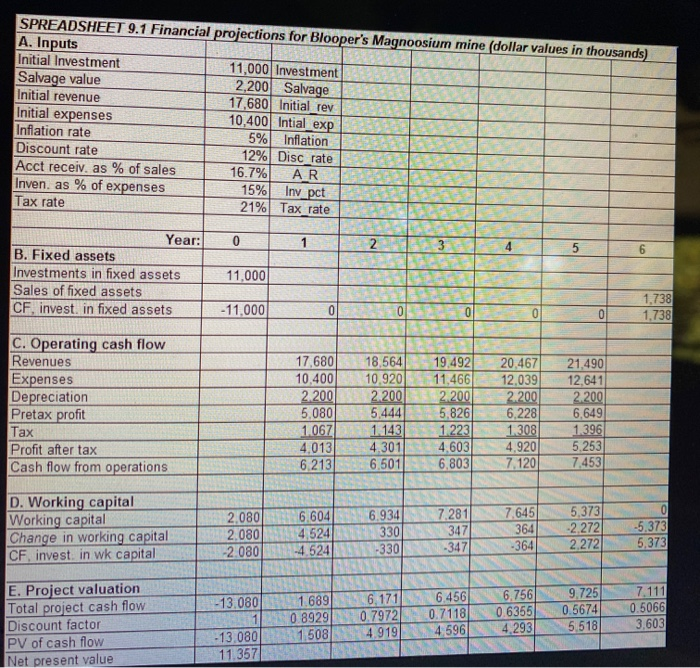
Suppose that Blooper's customers paid their bills with an average 3-month delay (Instead of 2 months) and that Blooper's inventories were 20% rather than 15% of next year's expenses. Use the below Blooper spreadsheet. See SPREADSHEET 91 in the eBook for the baseline project evaluation and resulting NPV assuming 15% Inventory expense SPREADSHEET 91 Financial projections for Blooper's Magnoosium mine (dollar values in thousands) Inputs Initial Investment Salvage value Initial revenue Initial expenses Inflation rate Discount rate Acet receiv. as of sales Inven. as of expenses Tax rate 11,000 2,200 17,680 10,400 0.05 0.12 1/4 0.2 0.21 Spreadsheet Name Investment Salvage Initial_rev Intial_exp Inflation Disc_rate A_R Inv pet Tax rate a. Would project NPV be higher or lower than that in the Blooper spreadsheet? Higher O Lower b. Calculate Blooper's working capital in each year of Its project. (Do not round Intermediate calculations. Round your answers nearest whole dollar amount.) Year Working Capital 0 1 2 3 4 5 6 c. What is the change in project NPV? (Do not round Intermediate calculations. Round your answers to the nearest whole amount.) The NPV from $4,223 to SPREADSHEET 9.1 Financial projections for Blooper's Magnoosium mine (dollar values in thousands) A. Inputs Initial Investment 11,000 Investment Salvage value 2,200 Salvage Initial revenue 17,680 Initial rev Initial expenses 10,400 Intial exp Inflation rate 5% Inflation Discount rate 12% Disc_rate Acct receiv, as % of sales 16.7% AR Inven. as % of expenses 15% Inv_pct Tax rate 21% Tax rate 0 1 NI 3 5 6 Year: B. Fixed assets Investments in fixed assets Sales of fixed assets CF, invest. in fixed assets 11,000 -11,000 0 0 0 1.738 1,738 C. Operating cash flow Revenues Expenses Depreciation Pretax profit Tax Profit after tax Cash flow from operations 17,680 10,400 2 200 5.080 1067 4,013 6.213 18,564 10.920 2.200 5.444 1.143 4.301 6.501 19.492 11,466 2.200 5,826 1223 4,603 6.803 20,467 12.039 2.200 6,228 1308 4,920 7. 120 21,490 12,641 2.200 6,649 1396 5.253 7,453 6.934 D. Working capital Working capital Change in working capital CF invest in wk capital 2.080 2,080 -2.080 6.604 4.524 -4.524 SISI 7.281 347 -347 7,645 364 -364 5.373 2.272 2.272 0 -5.373 5.373 -330 -13.080 E. Project valuation Total project cash flow Discount factor PV of cash flow Net present value 1.689 0.8929 1508 6.171 0.7972 4.919 6.456 0.7118 4.596 6.756 0.6355 4.293 9.725 0.5674 5.518) 7.111 0.5066 3,603 -13.080 11.357 Suppose that Blooper's customers paid their bills with an average 3-month delay (Instead of 2 months) and that Blooper's inventories were 20% rather than 15% of next year's expenses. Use the below Blooper spreadsheet. See SPREADSHEET 91 in the eBook for the baseline project evaluation and resulting NPV assuming 15% Inventory expense SPREADSHEET 91 Financial projections for Blooper's Magnoosium mine (dollar values in thousands) Inputs Initial Investment Salvage value Initial revenue Initial expenses Inflation rate Discount rate Acet receiv. as of sales Inven. as of expenses Tax rate 11,000 2,200 17,680 10,400 0.05 0.12 1/4 0.2 0.21 Spreadsheet Name Investment Salvage Initial_rev Intial_exp Inflation Disc_rate A_R Inv pet Tax rate a. Would project NPV be higher or lower than that in the Blooper spreadsheet? Higher O Lower b. Calculate Blooper's working capital in each year of Its project. (Do not round Intermediate calculations. Round your answers nearest whole dollar amount.) Year Working Capital 0 1 2 3 4 5 6 c. What is the change in project NPV? (Do not round Intermediate calculations. Round your answers to the nearest whole amount.) The NPV from $4,223 to SPREADSHEET 9.1 Financial projections for Blooper's Magnoosium mine (dollar values in thousands) A. Inputs Initial Investment 11,000 Investment Salvage value 2,200 Salvage Initial revenue 17,680 Initial rev Initial expenses 10,400 Intial exp Inflation rate 5% Inflation Discount rate 12% Disc_rate Acct receiv, as % of sales 16.7% AR Inven. as % of expenses 15% Inv_pct Tax rate 21% Tax rate 0 1 NI 3 5 6 Year: B. Fixed assets Investments in fixed assets Sales of fixed assets CF, invest. in fixed assets 11,000 -11,000 0 0 0 1.738 1,738 C. Operating cash flow Revenues Expenses Depreciation Pretax profit Tax Profit after tax Cash flow from operations 17,680 10,400 2 200 5.080 1067 4,013 6.213 18,564 10.920 2.200 5.444 1.143 4.301 6.501 19.492 11,466 2.200 5,826 1223 4,603 6.803 20,467 12.039 2.200 6,228 1308 4,920 7. 120 21,490 12,641 2.200 6,649 1396 5.253 7,453 6.934 D. Working capital Working capital Change in working capital CF invest in wk capital 2.080 2,080 -2.080 6.604 4.524 -4.524 SISI 7.281 347 -347 7,645 364 -364 5.373 2.272 2.272 0 -5.373 5.373 -330 -13.080 E. Project valuation Total project cash flow Discount factor PV of cash flow Net present value 1.689 0.8929 1508 6.171 0.7972 4.919 6.456 0.7118 4.596 6.756 0.6355 4.293 9.725 0.5674 5.518) 7.111 0.5066 3,603 -13.080 11.357


