Question
Suppose that utility depends on market goods consumption, ????, and time spent in non-market activities, ????. Indifference curves over combinations of these two goods are
Suppose that utility depends on market goods consumption, ????, and time spent in non-market activities, ????. Indifference curves over combinations of these two goods are different for different mothers, but are smooth and convex for all mothers.
All mothers have weekly time endowments of 80 hours per week that they can divide between market work and non-market activities. In this problem, mothers earn a wage $20 per hour in market work and have non-labor income of $200 per week. For this group of mothers, working in paid employment requires purchasing child care services, which cost $5 per hour for every hour worked. Thus, the net hourly wage from market work for these working mothers is $15 per hour.
Here are the questions relating to the information above. PLEASE HELP, THANKS!

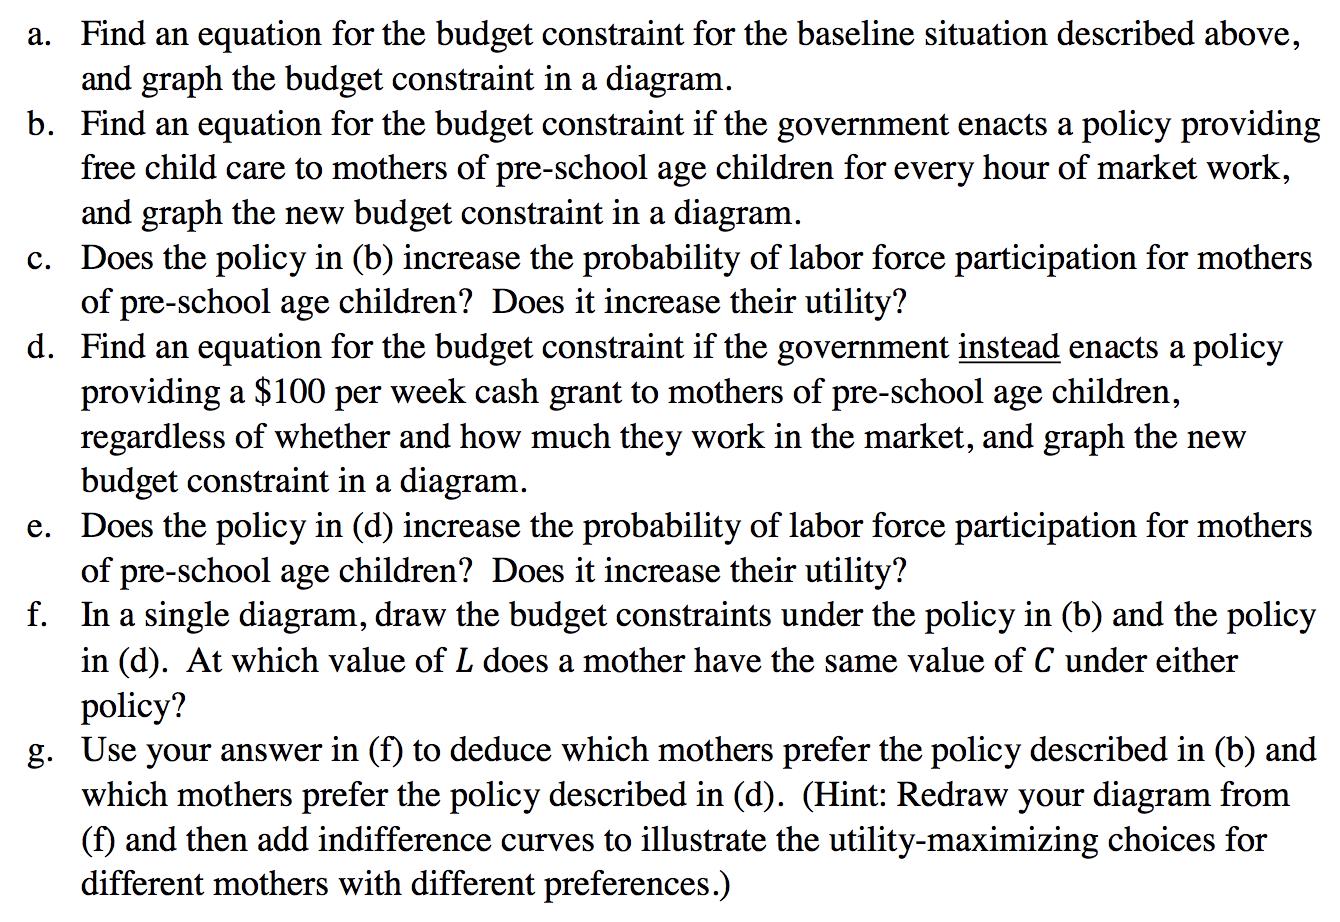
a. Find an equation for the budget constraint for the baseline situation described above, and graph the budget constraint in a diagram. b. Find an equation for the budget constraint if the government enacts a policy providing free child care to mothers of pre-school age children for every hour of market work, and graph the new budget constraint in a diagram. C. Does the policy in (b) increase the probability of labor force participation for mothers of pre-school age children? Does it increase their utility? d. Find an equation for the budget constraint if the government instead enacts a policy providing a $100 per week cash grant to mothers of pre-school age children, regardless of whether and how much they work in the market, and graph the new budget constraint in a diagram. Does the policy in (d) increase the probability of labor force participation for mothers of pre-school age children? Does it increase their utility? f. In a single diagram, draw the budget constraints under the policy in (b) and the policy in (d). At which value of L does a mother have the same value of C under either policy? e. g. Use your answer in (f) to deduce which mothers prefer the policy described in (b) and which mothers prefer the policy described in (d). (Hint: Redraw your diagram from (f) and then add indifference curves to illustrate the utility-maximizing choices for different mothers with different preferences.)
Step by Step Solution
3.40 Rating (156 Votes )
There are 3 Steps involved in it
Step: 1
a The budget constraint for the baseline situation is given by M C P T where M is total income C is expenditure on child care P is expenditure on mark...
Get Instant Access to Expert-Tailored Solutions
See step-by-step solutions with expert insights and AI powered tools for academic success
Step: 2

Step: 3

Ace Your Homework with AI
Get the answers you need in no time with our AI-driven, step-by-step assistance
Get Started


