

Answered step by step
Verified Expert Solution
Question
1 Approved Answer
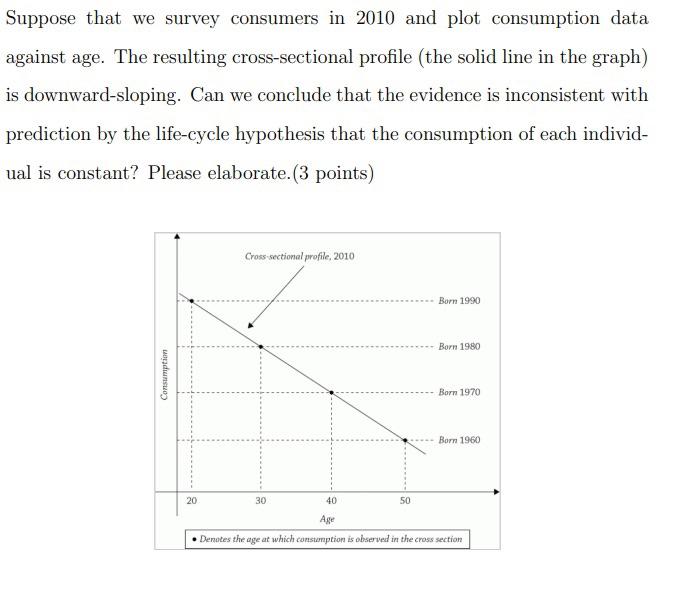
Suppose that we survey consumers in 2010 and plot consumption data against age. The resulting cross-sectional profile (the solid line in the graph) is downward-sloping.
Step by Step Solution
There are 3 Steps involved in it
Step: 1

Get Instant Access to Expert-Tailored Solutions
See step-by-step solutions with expert insights and AI powered tools for academic success
Step: 2

Step: 3
Ace Your Homework with AI
Get the answers you need in no time with our AI-driven, step-by-step assistance
Get Started
Challenging Global Finance
Authors: Elizabeth Friesen
2012th Edition
0230348793, 978-0230348790