Answered step by step
Verified Expert Solution
Question
1 Approved Answer
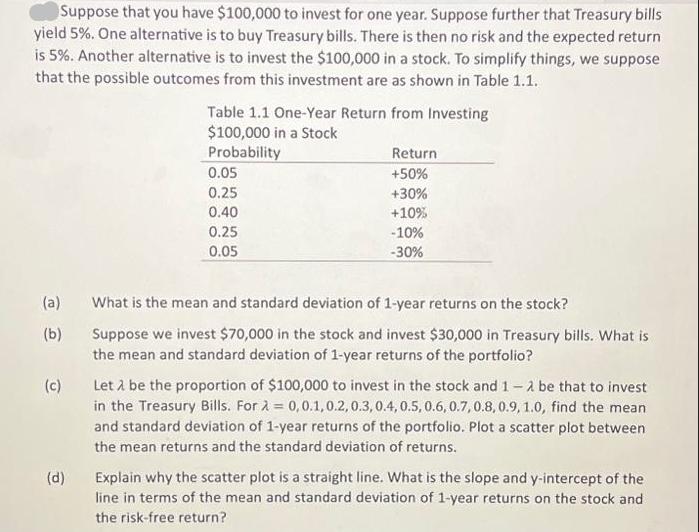
Suppose that you have $100,000 to invest for one year. Suppose further that Treasury bills yield 5%. One alternative is to buy Treasury bills.

Suppose that you have $100,000 to invest for one year. Suppose further that Treasury bills yield 5%. One alternative is to buy Treasury bills. There is then no risk and the expected return is 5%. Another alternative is to invest the $100,000 in a stock. To simplify things, we suppose that the possible outcomes from this investment are as shown in Table 1.1. (a) (b) Table 1.1 One-Year Return from Investing $100,000 in a Stock Probability (d) 0.05 0.25 0.40 0.25 0.05 Return +50% +30% +10% -10% -30% What is the mean and standard deviation of 1-year returns on the stock? Suppose we invest $70,000 in the stock and invest $30,000 in Treasury bills. What is the mean and standard deviation of 1-year returns of the portfolio? (c) Let be the proportion of $100,000 to invest in the stock and 1-2 be that to invest in the Treasury Bills. For = 0,0.1,0.2, 0.3, 0.4, 0.5, 0.6, 0.7, 0.8, 0.9, 1.0, find the mean and standard deviation of 1-year returns of the portfolio. Plot a scatter plot between the mean returns and the standard deviation of returns. Explain why the scatter plot is a straight line. What is the slope and y-intercept of the line in terms of the mean and standard deviation of 1-year returns on the stock and the risk-free return?
Step by Step Solution
★★★★★
3.50 Rating (160 Votes )
There are 3 Steps involved in it
Step: 1
a To calculate the mean and standard deviation of 1year returns on the stock we use the given probabilities and returns from Table 11 The mean return is calculated as the weighted average of the possi...
Get Instant Access to Expert-Tailored Solutions
See step-by-step solutions with expert insights and AI powered tools for academic success
Step: 2

Step: 3

Ace Your Homework with AI
Get the answers you need in no time with our AI-driven, step-by-step assistance
Get Started


