

Question: Suppose that you have in your possession bivariate data giving birthrate and life expectancy information for a random sample of 15 countries. For each
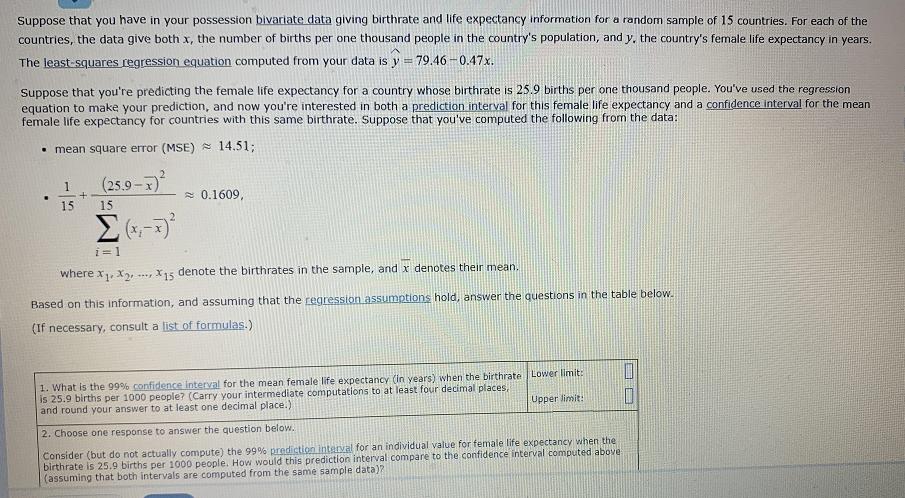

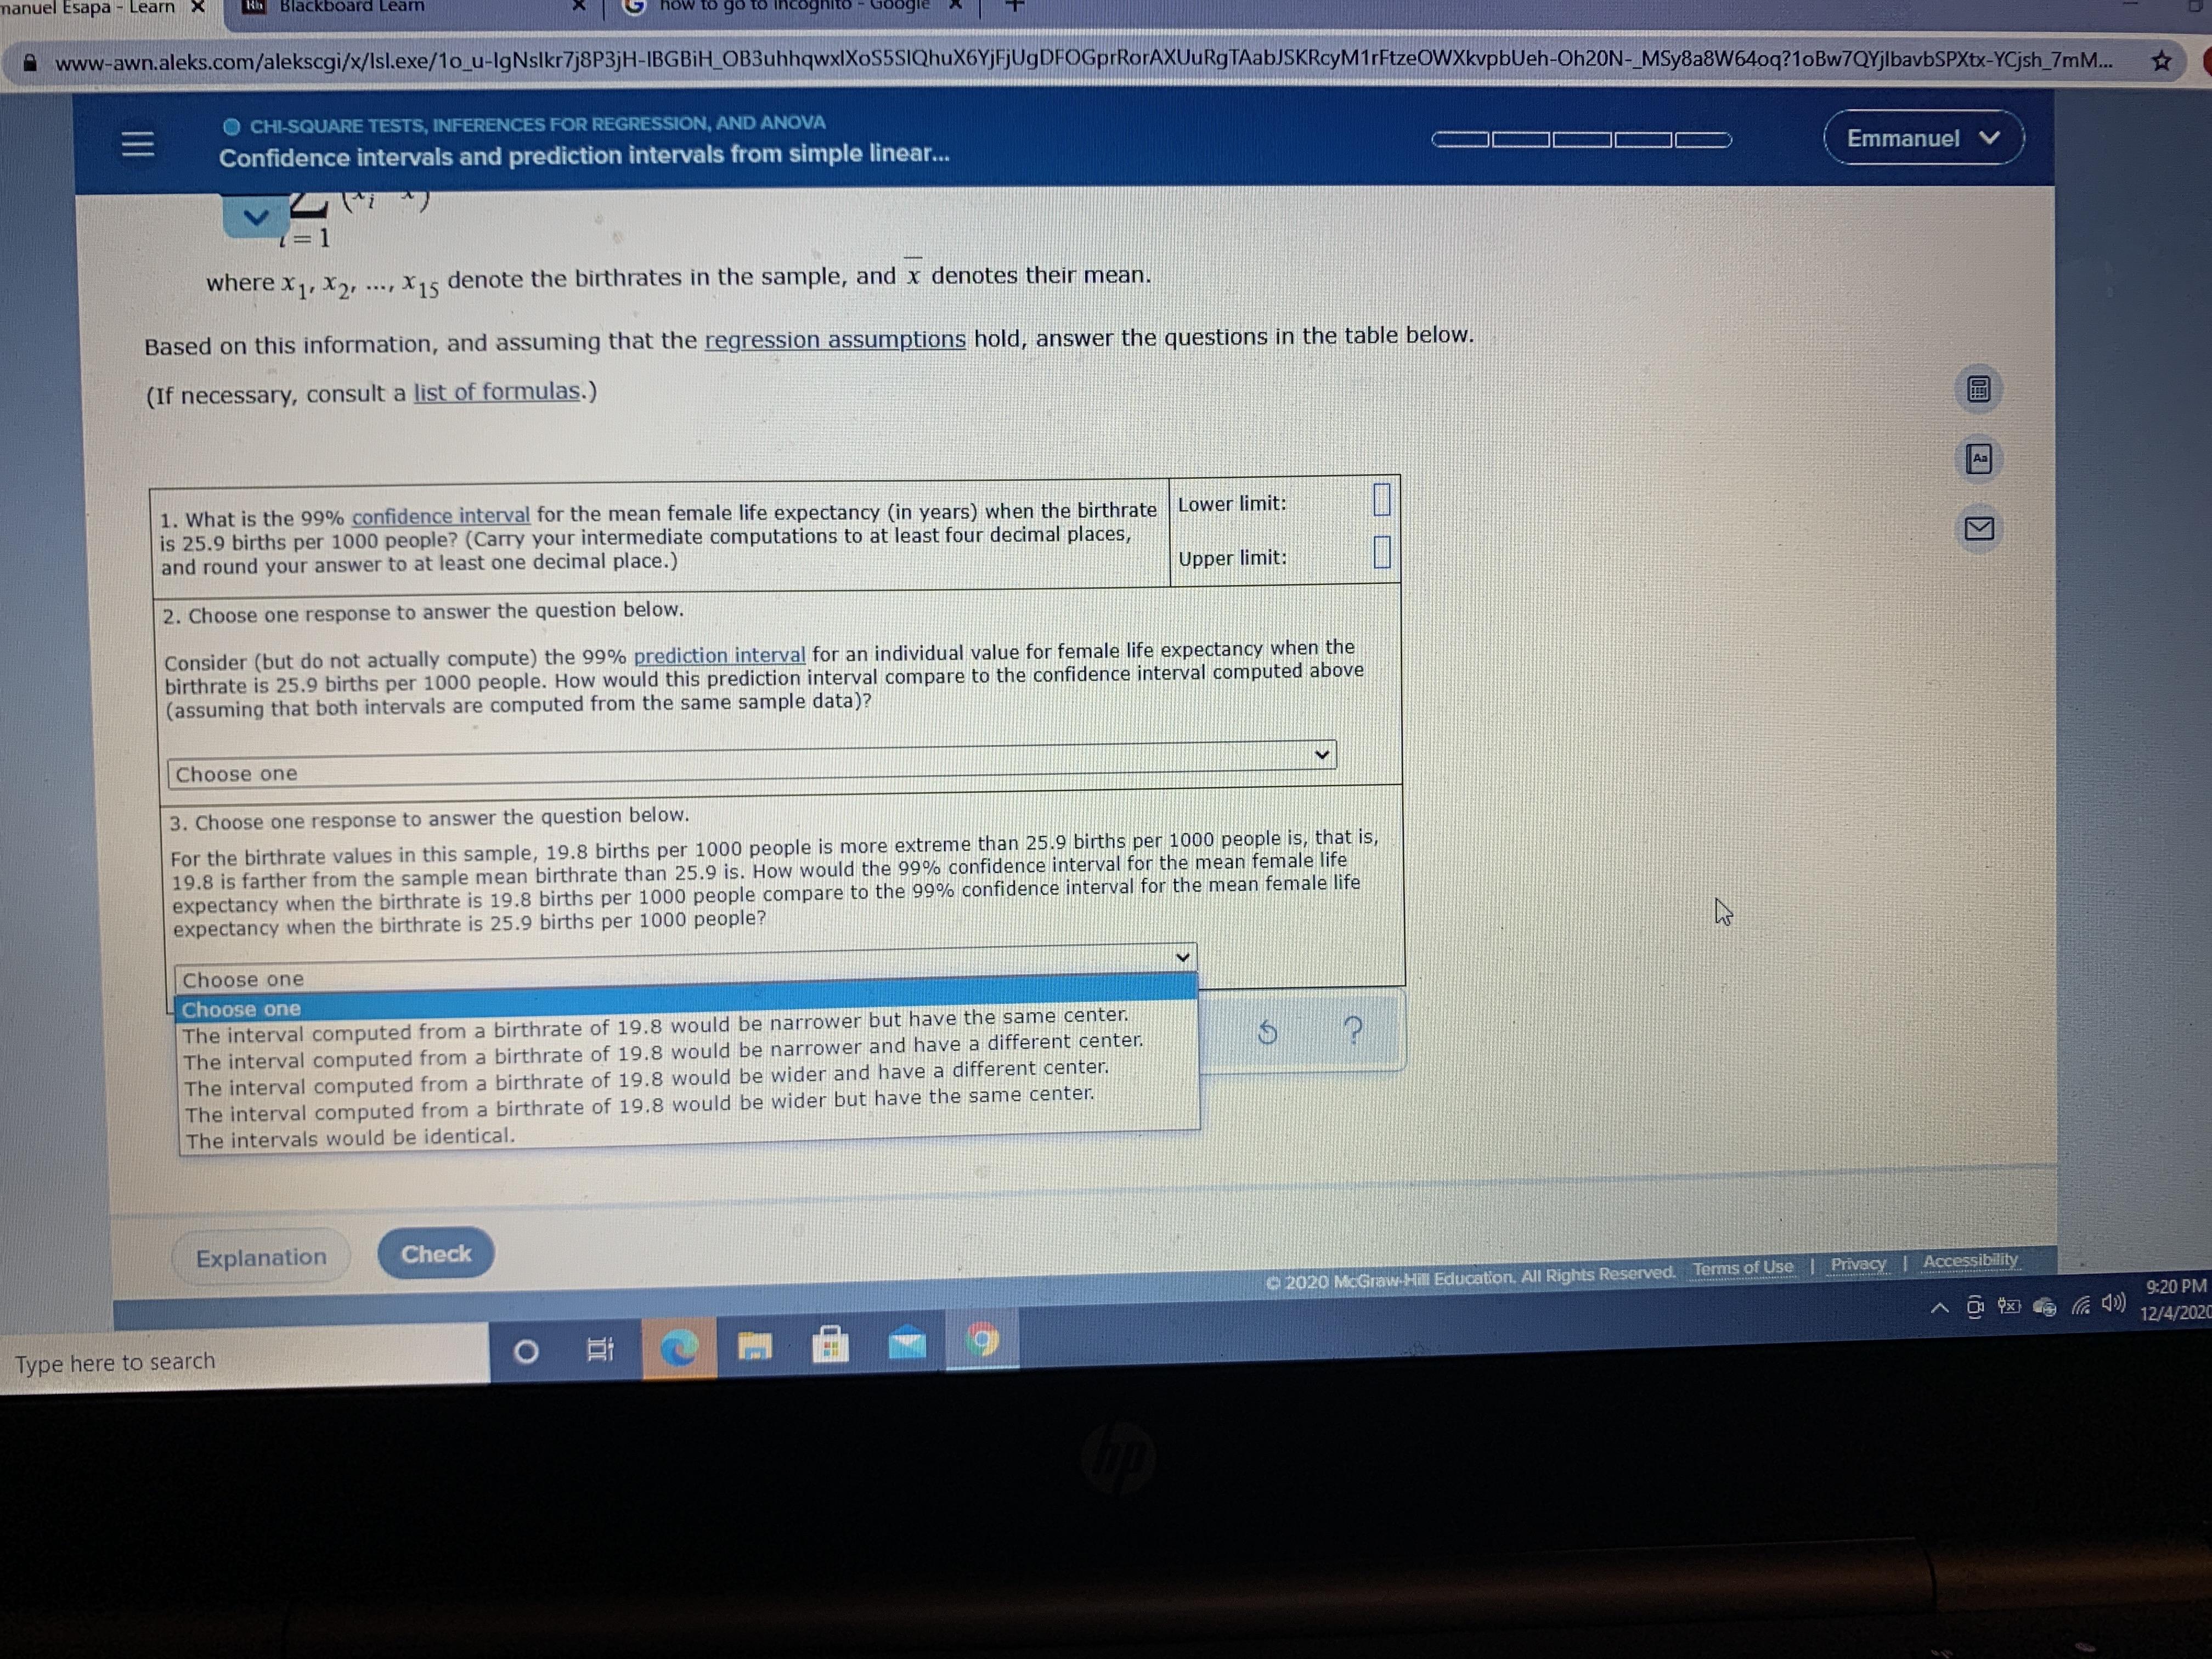
Suppose that you have in your possession bivariate data giving birthrate and life expectancy information for a random sample of 15 countries. For each of the countries, the data give both x, the number of births per one thousand people in the country's population, and y, the country's female life expectancy in years. The least-squares regression equation computed from your data is y = 79.46 -0.47x. %3! Suppose that you're predicting the female life expectancy for a country whose birthrate is 25.9 births per one thousand people. You've used the regression equation to make your prediction, and now you're interested in both a prediction interval for this female life expectancy and a confidence interval for the mean female life expectancy for countries with this same birthrate. Suppose that you've computed the following from the data: mean square error (MSE) = 14.51; (25.9 -) 2 0.1609, 15 15 i=1 where x, X, , X15 denote the birthrates in the sample, and x denotes their mean. Based on this information, and assuming that the regression assumptions hold, answer the questions in the table below. (If necessary, consult a list of formulas.) 1. What is the 99% confidence interval for the mean female life expectancy (in years) when the birthrate Lower limit: is 25.9 births per 1000 people? (Carry your intermediate computations to at least four decimal places, and round your answer to at least one decimal place.) Upper limit: 2. Choose one response to answer the question below. Consider (but do not actually compute) the 99% prediction interval for an individual value for female life expectancy when the birthrate is 25.9 births per 1000 people. How would this prediction interval compare to the confidence interval computed above (assuming that both intervals are computed from the same sample data)? nuel Esapa - Learn X Nh Blackboard Learn how to go to incognito - Google X www-awn.aleks.com/alekscgi/x/Isl.exe/1o_u-IgNslkr7j8P3jH-IBGBH_OB3uhhqwxIXoS5SIQhuX6YjFjUgDFOGprRorAXUuRgTAabJSKRcyM1rFtzeOWXkvpbUeh-Oh20N-_MSy8a8W64oq?1oBw7QYjlbavbSPXtx-YCjsh_7mM.. CHI-SQUARE TESTS, INFERENCES FOR REGRESSION, AND ANOVA Emmanuel V Confidence intervals and prediction intervals from simple linear... where x,, x, .., x15 denote the birthrates in the sample, and x denotes their mean. Based on this information, and assuming that the regression assumptions hold, answer the questions in the table below. (If necessary, consult a list of formulas.) Aa 1. What is the 99% confidence interval for the mean female life expectancy (in years) when the birthrate Lower limit: is 25.9 births per 1000 people? (Carry your intermediate computations to at least four decimal places, and round your answer to at least one decimal place.) Upper limit: 2. Choose one response to answer the question below. Consider (but do not actually compute) the 99% prediction interval for an individual value for female life expectancy when the birthrate is 25.9 births per 1000 people. How would this prediction interval compare to the confidence interval computed above (assuming that both intervals are computed from the same sample data)? Choose one Choose one The prediction interval would be identical to the confidence interval. The prediction interval would be positioned to the left of the confidence interval. The prediction interval would have the same center as, but would be narrower than, the confidence interval. The prediction interval would be positioned to the right of the confidence interval. The prediction interval would have the same center as, but would be wider than, the confidence interval. at is, ife Choose one Check Accessibility Explanation O 2020 McGraw-Hill Education. All Rights Reserved. Terms of Use | Privacy 9:20 PM 12/4/2020 Type here to search II manuel Esapa - Learn X Blackboard Learm how to go to incognito - Google A www-awn.aleks.com/alekscgi/x/lsl.exe/1o_u-IgNslkr7j8P3jH-IBGBIH_OB3uhhqwxlXoS5SIQhuX6YjFjUgDFOGprRorAXUuRgTAabJSKRcyM1rFtzeOWXkvpbUeh-Oh20N-_MSy8a8W64oq?1oBw7QYjlbavbSPXtx-YCjsh_7mM.. O CHI-SQUARE TESTS, INFERENCES FOR REGRESSION, AND ANOVA Emmanuel V Confidence intervals and prediction intervals from simple linear... (3D1 =D1 where x,, x,, ..., X15 denote the birthrates in the sample, and x denotes their mean. Based on this information, and assuming that the regression assumptions hold, answer the questions in the table below. (If necessary, consult a list of formulas.) Aa 1. What is the 99% confidence interval for the mean female life expectancy (in years) when the birthrate Lower limit: is 25.9 births per 1000 people? (Carry your intermediate computations to at least four decimal places, and round your answer to at least one decimal place.) Upper limit: 2. Choose one response to answer the question below. Consider (but do not actually compute) the 99% prediction interval for an individual value for female life expectancy when the birthrate is 25.9 births per 1000 people. How would this prediction interval compare to the confidence interval computed above (assuming that both intervals are computed from the same sample data)? Choose one 3. Choose one response to answer the question below. For the birthrate values in this sample, 19.8 births per 1000 people is more extreme than 25.9 births per 1000 people is, that is, 19.8 is farther from the sample mean birthrate than 25.9 is. How would the 99% confidence interval for the mean female life expectancy when the birthrate is 19.8 births per 1000 people compare to the 99% confidence interval for the mean fenmale life expectancy when the birthrate is 25.9 births per 1000 people? Choose one Choose one The interval computed from a birthrate of 19.8 would be narrower but have the same center. The interval computed from a birthrate of 19.8 would be narrower and have a different center. The interval computed from a birthrate of 19.8 would be wider and have a different center. The interval computed from a birthrate of 19.8 would be wider but have the same center. The intervals would be identical. Explanation Check 2020 McGraw-Hill Educantion, All Rightts Reserved. Terms of Use Privacy | Accessibility 9:20 PM 12/4/2020 6. Type here to search
Step by Step Solution
3.36 Rating (168 Votes )
There are 3 Steps involved in it

Get step-by-step solutions from verified subject matter experts