

Question
Suppose that you want to test the hypothesis that mothers with low socioeconomic status (SES) deliver babies whose birthweights are lower than normal at the
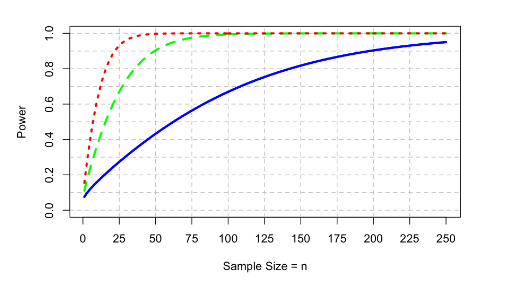
Suppose that you want to test the hypothesis that mothers with low socioeconomic status (SES) deliver babies whose birthweights are lower than "normal" at the 5% significance level.To test this hypothesis, you want to conduct a study in which you collect data from full-term live-born deliveries from various maternity wards of hospitals in low SES areas. It is assumed that the standard deviation of birthweights is 24 oz. A national survey has shown that "normal" birthweight is 120 oz.
You want to consider being able to detect differences of 5 oz, 10 oz, or 15 oz below normal birthweight. You decide to construct a power curve for each one of these differences where you look at power as a function of sample size. These three power curves are provided below.

Step by Step Solution
There are 3 Steps involved in it
Step: 1

Get Instant Access to Expert-Tailored Solutions
See step-by-step solutions with expert insights and AI powered tools for academic success
Step: 2

Step: 3
Ace Your Homework with AI
Get the answers you need in no time with our AI-driven, step-by-step assistance
Get Started
College Geometry A Discovery Approach
Authors: David Kay
2nd Edition
0321830954, 9780321830951