Question
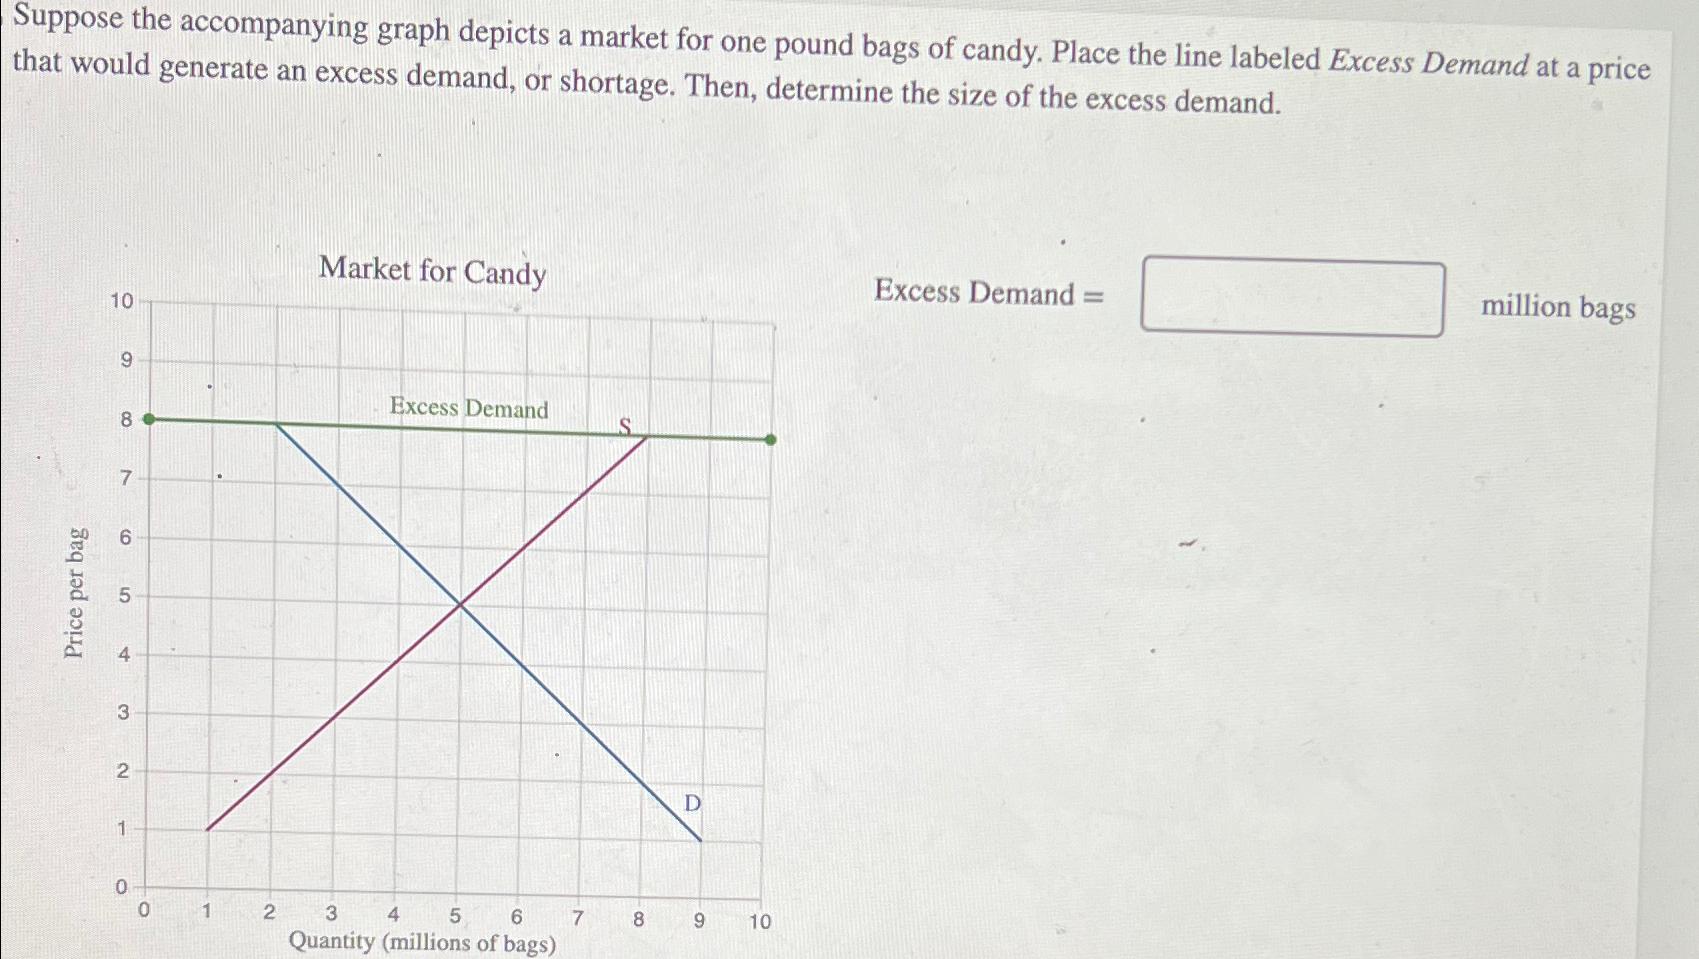
Suppose the accompanying graph depicts a market for one pound bags of candy. Place the line labeled Excess Demand at a price that would

Suppose the accompanying graph depicts a market for one pound bags of candy. Place the line labeled Excess Demand at a price that would generate an excess demand, or shortage. Then, determine the size of the excess demand. Price per bag 10 9 8 7 6 5 4 3 2 1 0 0 1 2 Market for Candy Excess Demand 3 4 5 6 Quantity (millions of bags) 7 S 8 D 9 10 Excess Demand: = million bags
Step by Step Solution
There are 3 Steps involved in it
Step: 1
To determine the excess demand in the market for candy we need to locate the price at whi...
Get Instant Access to Expert-Tailored Solutions
See step-by-step solutions with expert insights and AI powered tools for academic success
Step: 2

Step: 3

Ace Your Homework with AI
Get the answers you need in no time with our AI-driven, step-by-step assistance
Get StartedRecommended Textbook for
Introduction To Chemical Principles
Authors: H. Stephen Stoker
11th Edition
0321814630, 978-0321814630
Students also viewed these Economics questions
Question
Answered: 1 week ago
Question
Answered: 1 week ago
Question
Answered: 1 week ago
Question
Answered: 1 week ago
Question
Answered: 1 week ago
Question
Answered: 1 week ago
Question
Answered: 1 week ago
Question
Answered: 1 week ago
Question
Answered: 1 week ago
Question
Answered: 1 week ago
Question
Answered: 1 week ago
Question
Answered: 1 week ago
Question
Answered: 1 week ago
Question
Answered: 1 week ago
Question
Answered: 1 week ago
Question
Answered: 1 week ago
Question
Answered: 1 week ago
Question
Answered: 1 week ago
Question
Answered: 1 week ago
Question
Answered: 1 week ago
Question
Answered: 1 week ago
Question
Answered: 1 week ago
Question
Answered: 1 week ago
View Answer in SolutionInn App


