Answered step by step
Verified Expert Solution
Question
1 Approved Answer
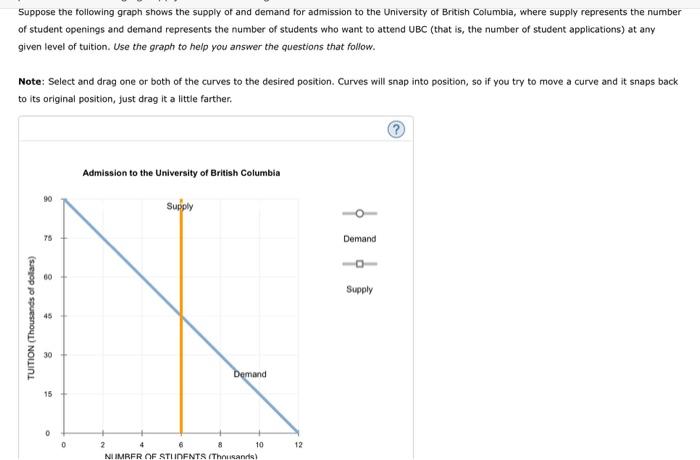
Suppose the following graph shows the supply of and demand for admission to the University of British Columbia, where supply represents the number of


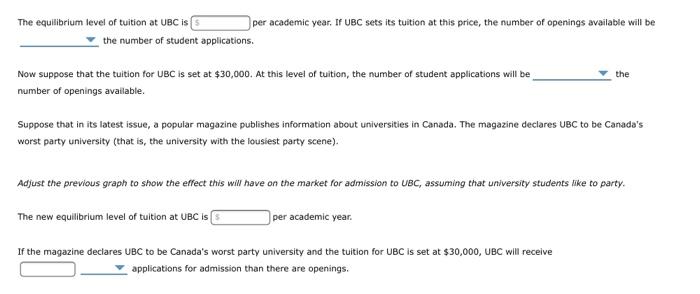
Suppose the following graph shows the supply of and demand for admission to the University of British Columbia, where supply represents the number of student openings and demand represents the number of students who want to attend UBC (that is, the number of student applications) at any given level of tuition. Use the graph to help you answer the questions that follow. Note: Select and drag one or both of the curves to the desired position. Curves will snap into position, so if you try to move a curve and it snaps back to its original position, just drag it a little farther. 90 75 60 g 15 45 TUITION (Thousands of dollars) 30 Admission to the University of British Columbia 15 0 2 Supply Demand 10 12 NUMBER OF STUDENTS (Thousands) Demand Supply The equilibrium level of tuition at UBC is 5 per academic year. If UBC sets its tuition at this price, the number of openings available will be the number of student applications. Now suppose that the tuition for UBC is set at $30,000. At this level of tuition, the number of student applications will be number of openings available. the Suppose that in its latest issue, a popular magazine publishes information about universities in Canada. The magazine declares UBC to be Canada's worst party university (that is, the university with the lousiest party scene). Adjust the previous graph to show the effect this will have on the market for admission to UBC, assuming that university students like to party. The new equilibrium level of tuition at UBC is ( per academic year. If the magazine declares UBC to be Canada's worst party university and the tuition for UBC is set at $30,000, UBC will receive applications for admission than there are openings.
Step by Step Solution
There are 3 Steps involved in it
Step: 1

Get Instant Access to Expert-Tailored Solutions
See step-by-step solutions with expert insights and AI powered tools for academic success
Step: 2

Step: 3

Ace Your Homework with AI
Get the answers you need in no time with our AI-driven, step-by-step assistance
Get Started


