Question
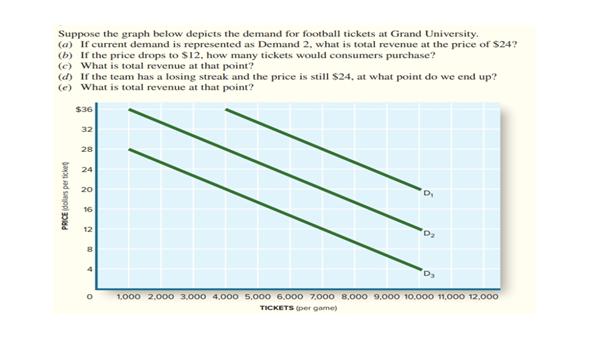
Suppose the graph below depicts the demand for football tickets at Grand University. (a) If current demand is represented as Demand 2, what is

Suppose the graph below depicts the demand for football tickets at Grand University. (a) If current demand is represented as Demand 2, what is total revenue at the price of $24? (b) If the price drops to $12, how many tickets would consumers purchase? (c) What is total revenue at that point? (d) If the team has a losing streak and the price is still $24, at what point do we end up? (e) What is total revenue at that point? PRICE (dollars per ticket $36 32 28 24 20 16 12 8 0 D 1,000 2,000 3,000 4,000 5,000 6.000 7.000 8.000 9.000 10.000 11,000 12,000 TICKETS (per game)
Step by Step Solution
3.48 Rating (151 Votes )
There are 3 Steps involved in it
Step: 1

Get Instant Access to Expert-Tailored Solutions
See step-by-step solutions with expert insights and AI powered tools for academic success
Step: 2

Step: 3

Ace Your Homework with AI
Get the answers you need in no time with our AI-driven, step-by-step assistance
Get StartedRecommended Textbook for
Organic Chemistry
Authors: John McMurry
7 Edition
978-0495112587, 0495112585
Students also viewed these Accounting questions
Question
Answered: 1 week ago
Question
Answered: 1 week ago
Question
Answered: 1 week ago
Question
Answered: 1 week ago
Question
Answered: 1 week ago
Question
Answered: 1 week ago
Question
Answered: 1 week ago
Question
Answered: 1 week ago
Question
Answered: 1 week ago
Question
Answered: 1 week ago
Question
Answered: 1 week ago
Question
Answered: 1 week ago
Question
Answered: 1 week ago
Question
Answered: 1 week ago
Question
Answered: 1 week ago
Question
Answered: 1 week ago
Question
Answered: 1 week ago
Question
Answered: 1 week ago
Question
Answered: 1 week ago
Question
Answered: 1 week ago
Question
Answered: 1 week ago
View Answer in SolutionInn App


