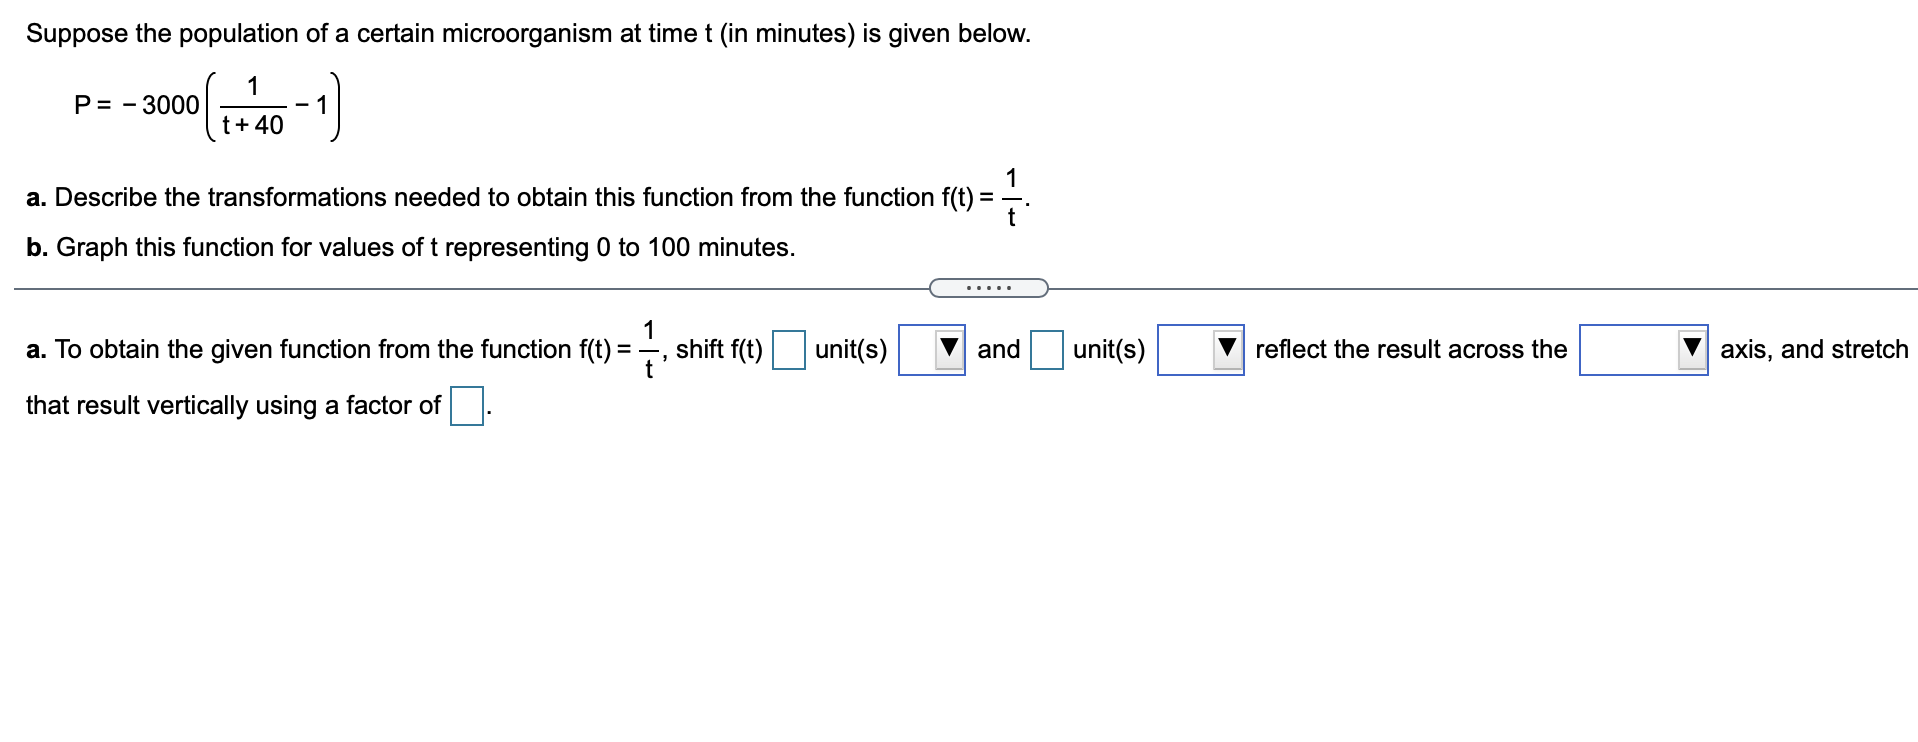
Suppose the population of a certain microorganism at time t (in minutes) is given below. P = - 3000 t + 40 a. Describe the
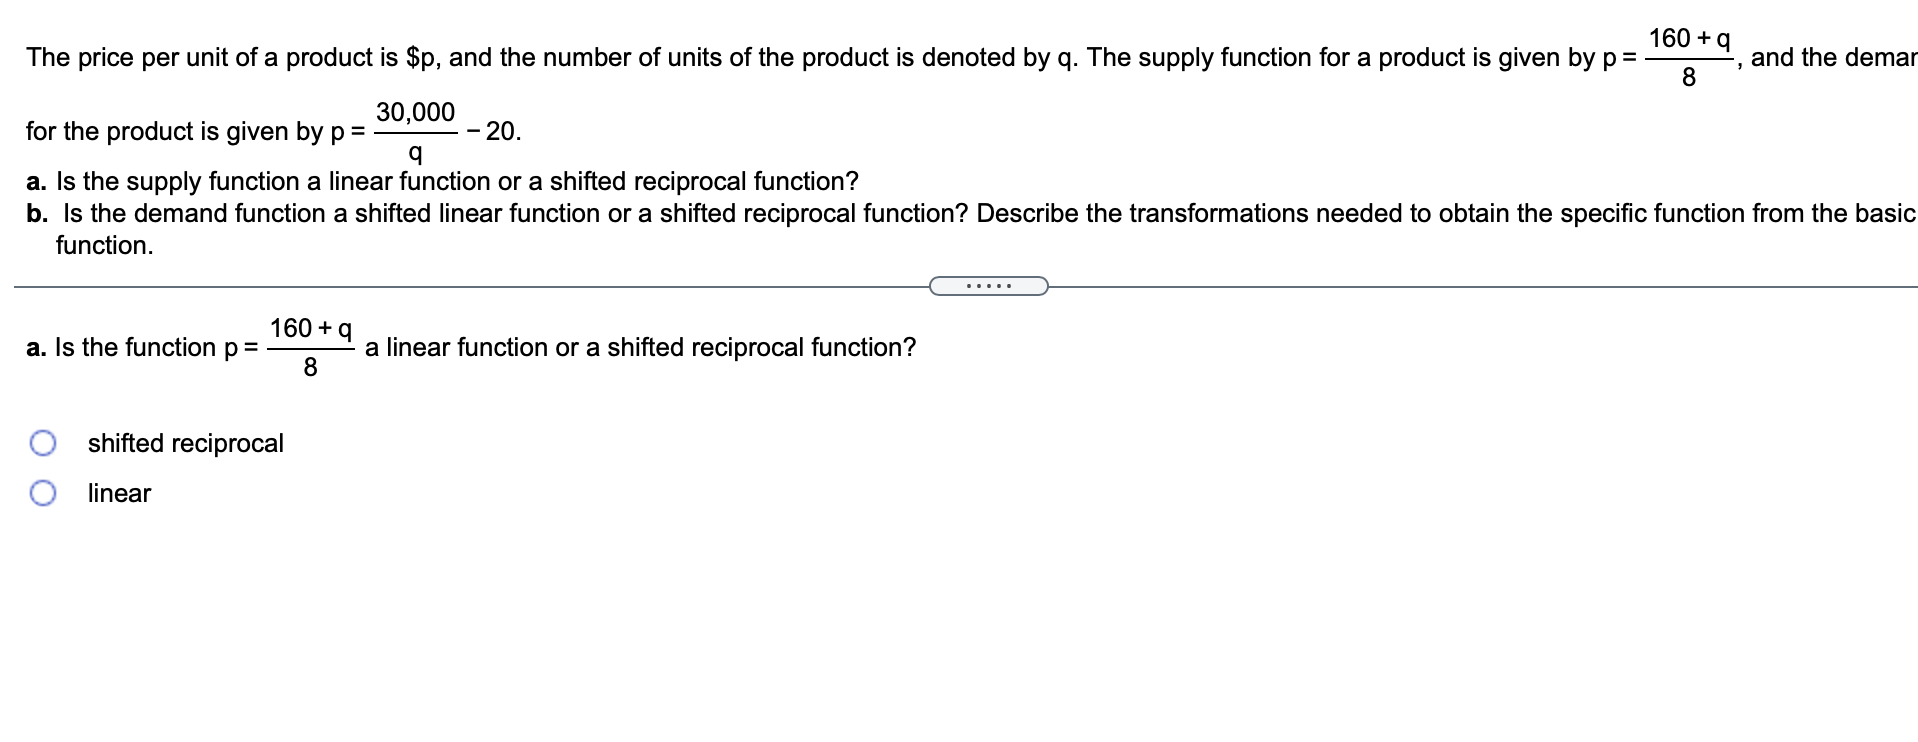
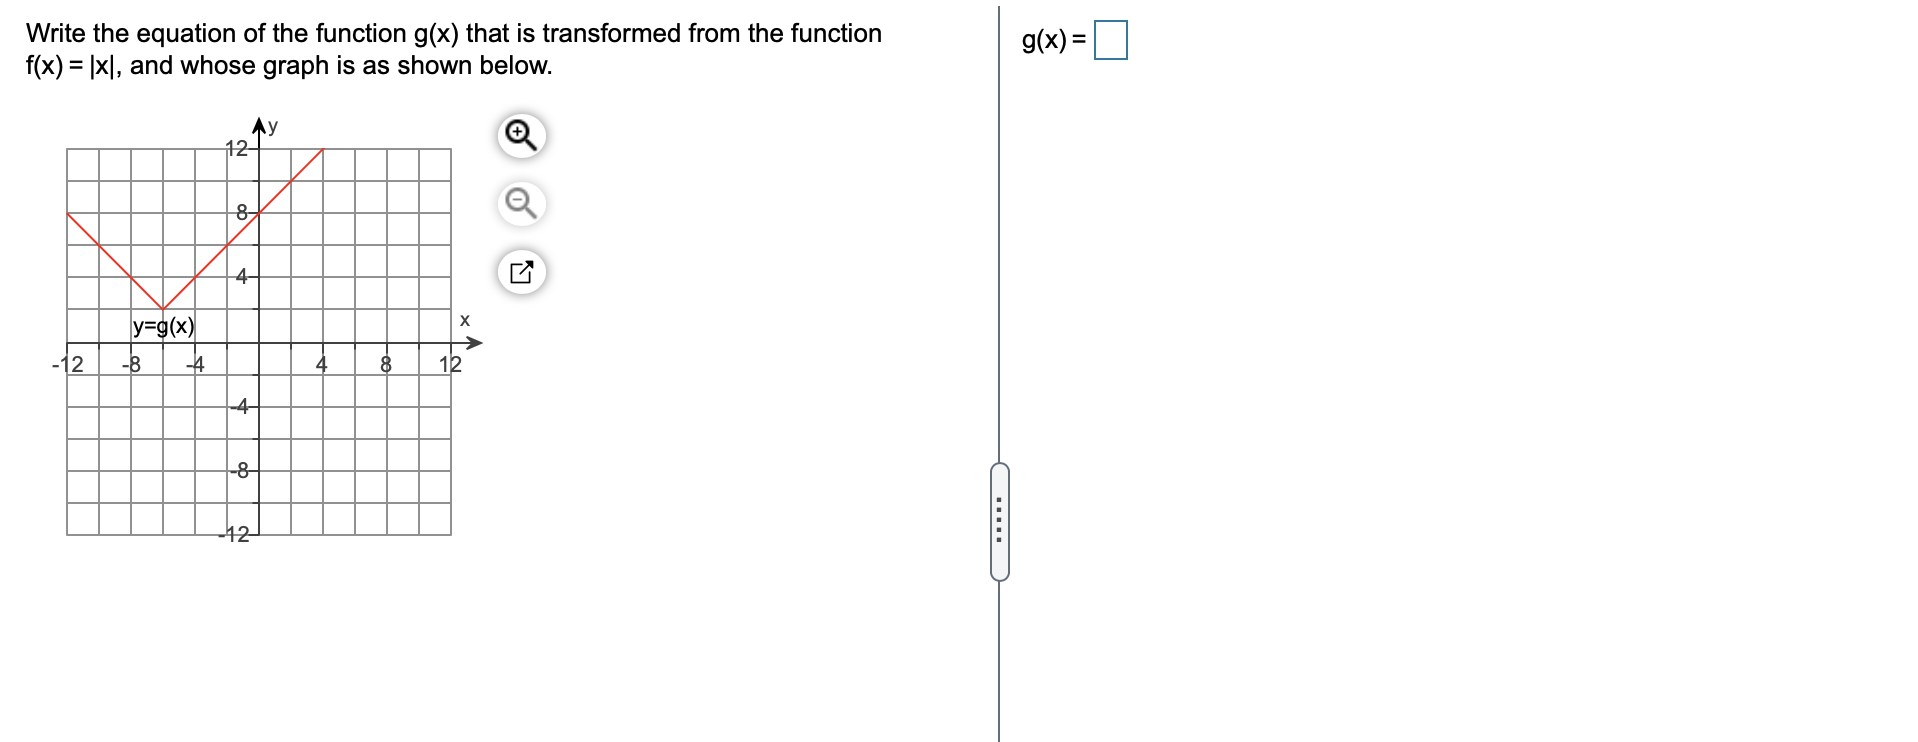
Suppose the population of a certain microorganism at time t (in minutes) is given below. P = - 3000 t + 40 a. Describe the transformations needed to obtain this function from the function f(t) = - b. Graph this function for values of t representing 0 to 100 minutes. . . . . . a. To obtain the given function from the function f(t) = -, shift f(t) unit(s) and unit ( s ) reflect the result across the axis, and stretch that result vertically using a factor of160 + q The price per unit of a product is $p, and the number of units of the product is denoted by q. The supply function for a product is given by p = and the demar 8 30,000 for the product is given by p = -20. q a. Is the supply function a linear function or a shifted reciprocal function? b. Is the demand function a shifted linear function or a shifted reciprocal function? Describe the transformations needed to obtain the specific function from the basic function. . . . . . a. Is the function p = 160 + q a linear function or a shifted reciprocal function? 8 O shifted reciprocal O linearWrite the equation of the function g(x) that is transformed from the function f(x) = |x|. and whose graph is as shown below. 1 Suppose the graph of f(x) = ; is stretched vertically by a factor of 4 and then shifted up 1 unit. What is the equation of the new graph? Verify the result graphically. The equation of the new graph is g(x) = :l. (Simplify your answer.) Suppose the graph of y = x " is stretched by a factor of 9 and then shifted up 4 units. What is the equation that gives the new graph? . . . . . The equation that gives the new graph is y =Consider the functions y = |x| and y = Ix - 6| +1. (a) Sketch the graph of the pair of functions using a standard window. (b) Describe the transformations used to obtain the graph of the second function from the rst function. (a) Graph both functions on the same coordinate grid. Click to enlarge - graph Complete the following statement. The range of the squaring function, f(x) = x2, is . The range of the squaring function, f(x) = x2, is E. (Type your answer in interval notation.) Complete the following statement. The reciprocal function, f(x) = -, decreases on x . . . . . The reciprocal function, f(x) = -, decreases on (Type your answer in interval notation.)Complete the following statement. The domain of the reciprocal function, f(x) = -, is X and its range is . . . . . The domain of the reciprocal function, f(x) = -, is X , and its range is (Type your answers in interval notation.)The table gives a country's gross domestic product (GDP) (in trillions of dollars) for selected years GDP GDP GDP from 2005 and projected to 2070. Complete parts (a) through (c) below. Year Year Year ($ trillions ($ trillions) ($ trillions) 2005 12.142 2030 46.756 2055 173.164 2010 16.169 2035 61.100 2060 224.048 2015 21.265 2040 79.675 2065 290.052 2020 27.685 2045 103.443 2070 375.208 2025 35.914 2050 133.914 . . . . . a. Find the best-fitting quadratic model for the data, with x equal to number of years after 2000. y = () x2 +( > x+0) (Type integers or decimals rounded to three decimal places as needed.)The following table gives the monthly insurance rates for a $100,000 life insurance policy for smokers Monthly Monthly Monthly Age Age Age 35-50 years of age. Complete parts (a) through (d) below. Insurance (yr) Insurance (yr) Rate ($) (yr) Insurance Rate ($) Rate ($) 35 17.33 41 21.00 47 29.39 36 17.66 42 22.21 48 30.81 37 18.03 43 23.72 49 32.55 38 18.45 44 25.12 50 34.46 39 19.09 45 26.58 40 19.96 46 28.00 . . . . . a. Create a scatter plot for the data. Choose the correct graph below. O A. B. O C. O D. + + + + . . . All graphs are shown in [35,50] by [17,35] with Xscl=1 and Ysol=1 viewing rectangles. b. Does it appear that a quadratic function can be used to model the data? If so, find the best-fitting quadratic model. O A. Yes, the best-fitting quadratic model is y = ()x2 + ()x+(). (Type integers or decimals rounded to three decimal places as needed.). O B. NoPrevious Question , The table gives the percent of total ho_d couples for selected years from 1982 and prolected to Year Percent 2050. Complete parts (a) through (c) below. 1932 47 1990 46 2000 45 2010 44 3. Find the quadratic function that best models the data, with x representing the number of years after 1980 and y representing the percent. y=(| )x2+( |)x+( ) (Type integers or decimals rounded to three decimal places as needed.) Find the quadratic function that models the data in the table below. X - 2 - 1 0 1 2 3 4 5 6 7 8 9 10 y 26 9 0 - 1 6 21 44 75 114 161 216 279 350 . . . . . The equation of the quadratic function that models the given data is y = x + X + 0Find the equation of the quadratic function whose graph is a parabola containing the points (0,1), (3,4), and (- 1,8). I ..... '\\ E The equation of the quadratic function whose graph is a parabola containing the given points is y = E. (Type an equation using x as the variable.)
Step by Step Solution
There are 3 Steps involved in it
Step: 1
Get Instant Access to Expert-Tailored Solutions
See step-by-step solutions with expert insights and AI powered tools for academic success
Step: 2
Step: 3
Ace Your Homework with AI
Get the answers you need in no time with our AI-driven, step-by-step assistance