Question
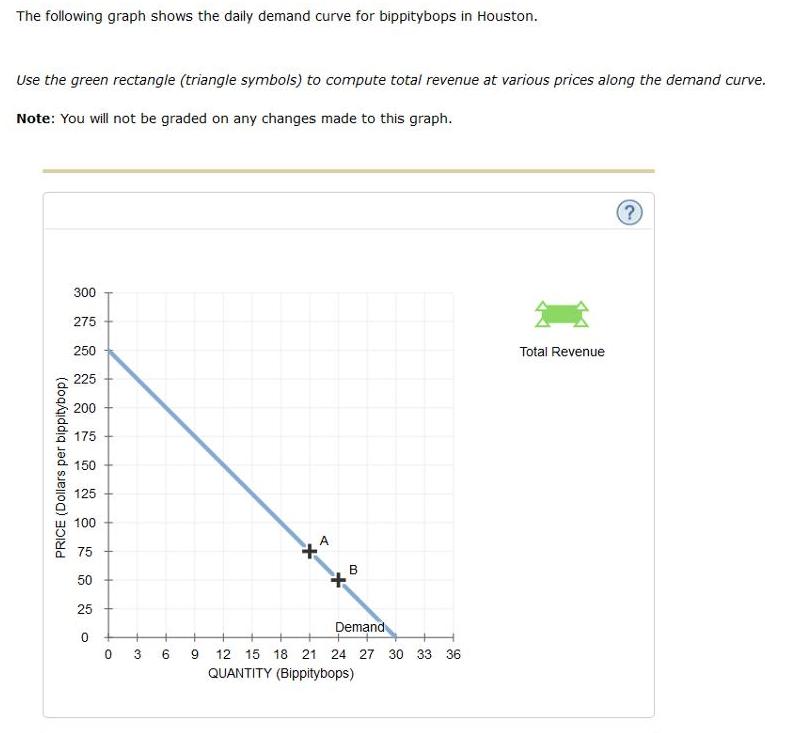
1. According to the midpoint method, the price elasticity of demand between points A and B on the initial graph is approximately (0, 0.33, 3,


1. According to the midpoint method, the price elasticity of demand between points A and B on the initial graph is approximately (0, 0.33, 3, 7.5).
2. Suppose the price of bippitybops is currently $50 per bippitybop, shown as point B on the initial graph. Because the price elasticity of demand between points A and B is(elastic, inelastic, unit elastic), a $25-per-bippitybop increase in price will lead to (a decrease, an increase, no change) in total revenue per day.
3. In general, in order for a price decrease to casue a total decrease in total revenue, demand must be (elastic, inelastic, unit elastic).
The following graph shows the daily demand curve for bippitybops in Houston. Use the green rectangle (triangle symbols) to compute total revenue at various prices along the demand curve. Note: You will not be graded on any changes made to this graph. 300 275 250 Total Revenue 225 200 175 150 125 100 75 50 25 Demand 0 3 12 15 18 21 24 27 30 33 36 QUANTITY (Bippitybops) PRICE (Dollars per bippitybop)
Step by Step Solution
3.45 Rating (155 Votes )
There are 3 Steps involved in it
Step: 1
Following table shows the Total Revenue schedule Price Quantity Total Revenue Price Quantity 50 24 1...
Get Instant Access to Expert-Tailored Solutions
See step-by-step solutions with expert insights and AI powered tools for academic success
Step: 2

Step: 3

Document Format ( 2 attachments)
635e1ada2e38c_181494.pdf
180 KBs PDF File
635e1ada2e38c_181494.docx
120 KBs Word File
Ace Your Homework with AI
Get the answers you need in no time with our AI-driven, step-by-step assistance
Get Started


