Answered step by step
Verified Expert Solution
Question
1 Approved Answer
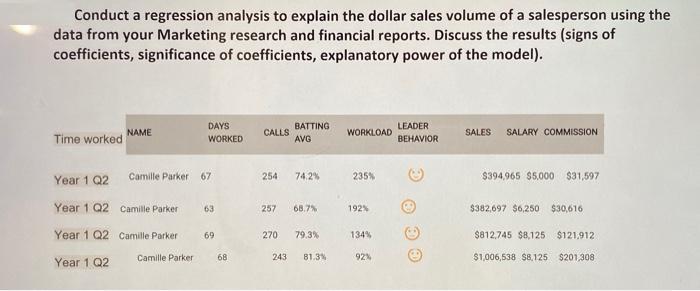
Conduct a regression analysis to explain the dollar sales volume of a salesperson using the data from your Marketing research and financial reports. Discuss

Conduct a regression analysis to explain the dollar sales volume of a salesperson using the data from your Marketing research and financial reports. Discuss the results (signs of coefficients, significance of coefficients, explanatory power of the model). Time worked Year 1 Q2 Year 1 Q2 Year 1 Q2 Year 1 Q2 NAME Camille Parker 67 Camille Parker Camille Parker DAYS WORKED Camille Parker 63 69 68 CALLS BATTING AVG 254 74.2% 257 68.7% 270 79.3% 243 81.3% WORKLOAD 235% 192% 134% 92% LEADER BEHAVIOR SALES SALARY COMMISSION $394,965 $5,000 $31,597 $382,697 $6,250 $30,616. $812,745 $8,125 $121,912 $1,006,538 $8,125 $201,308
Step by Step Solution
★★★★★
3.34 Rating (157 Votes )
There are 3 Steps involved in it
Step: 1
The results of the regression analysis indicate that the dollar sales volume of a salesperson is ...
Get Instant Access to Expert-Tailored Solutions
See step-by-step solutions with expert insights and AI powered tools for academic success
Step: 2

Step: 3

Ace Your Homework with AI
Get the answers you need in no time with our AI-driven, step-by-step assistance
Get Started


