Answered step by step
Verified Expert Solution
Link Copied!

Question

1 Approved Answer

Suppose we have some raw data. We randomly select two observations from this dataset, then record the mean of those two observations. We do this

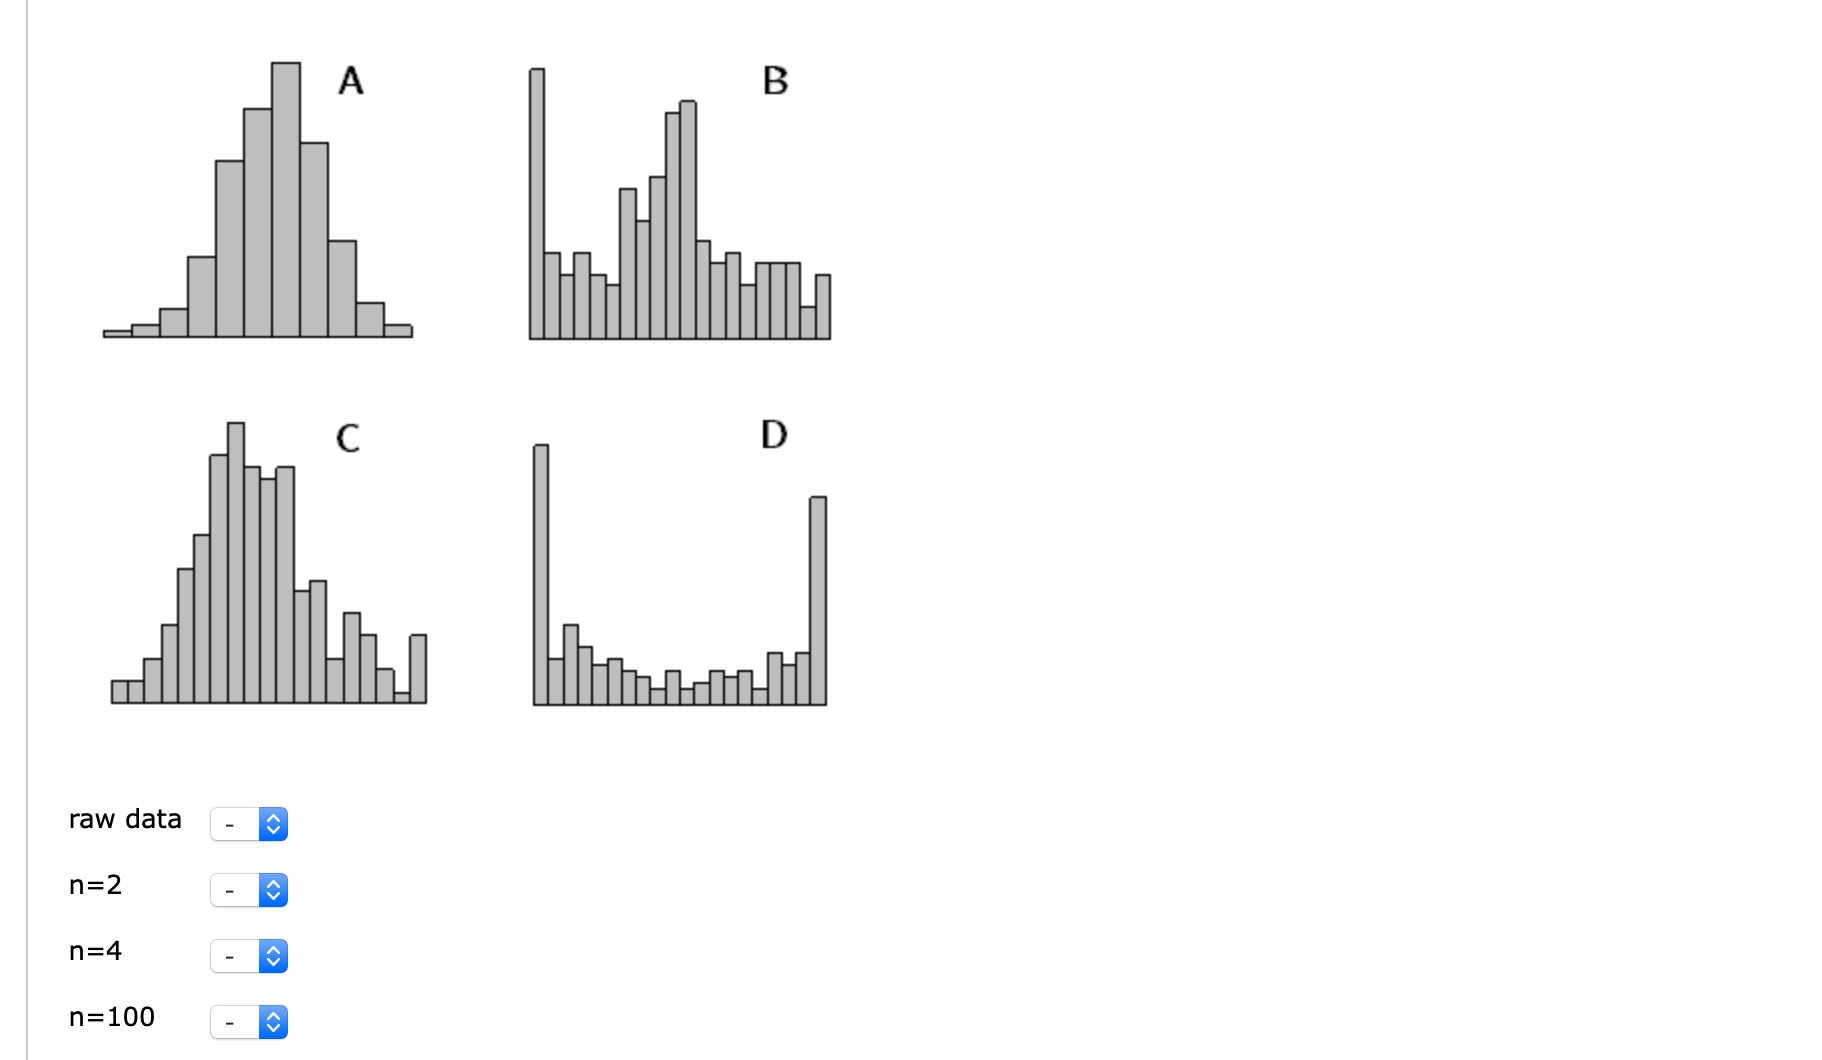
image text in transcribedimage text in transcribed
Suppose we have some raw data. We randomly select two observations from this dataset, then record the mean of those two observations. We do this over and over again, and in so doing we create a new dataset, consisting of the means of samples of size n=2 from the original data. Next, we perform the same procedure of randomly selecting observations from the original dataset and taking the mean, except this time we take samples of size n=4, and record these as another new dataset. Finally, we perform the same procedure again with samples of size n=100. Below are four histograms, labeled A, B, C, and D. Identify which is the histogram of raw data, and which are the histograms of the sample means for n=2, n=4, and n=100. \f

Step by Step Solution

There are 3 Steps involved in it

Step: 1

blur-text-image

Get Instant Access to Expert-Tailored Solutions

See step-by-step solutions with expert insights and AI powered tools for academic success

Step: 2

blur-text-image

Step: 3

blur-text-image

Ace Your Homework with AI

Get the answers you need in no time with our AI-driven, step-by-step assistance

Get Started

Recommended Textbook for

Probability With Applications and R

Authors: Robert P. Dobrow

1st edition

1118241257, 1118241258, 978-1118241257

More Books

Students also viewed these Mathematics questions

Question

Using z-table what is the area that lies to the left ofz = 2.26 ?

Answered: 1 week ago