

Question
Suppose we have the following data: Y = [ 55 71; ... 42 67; ... 40 60; ... 38 57 ]; E = [ 5
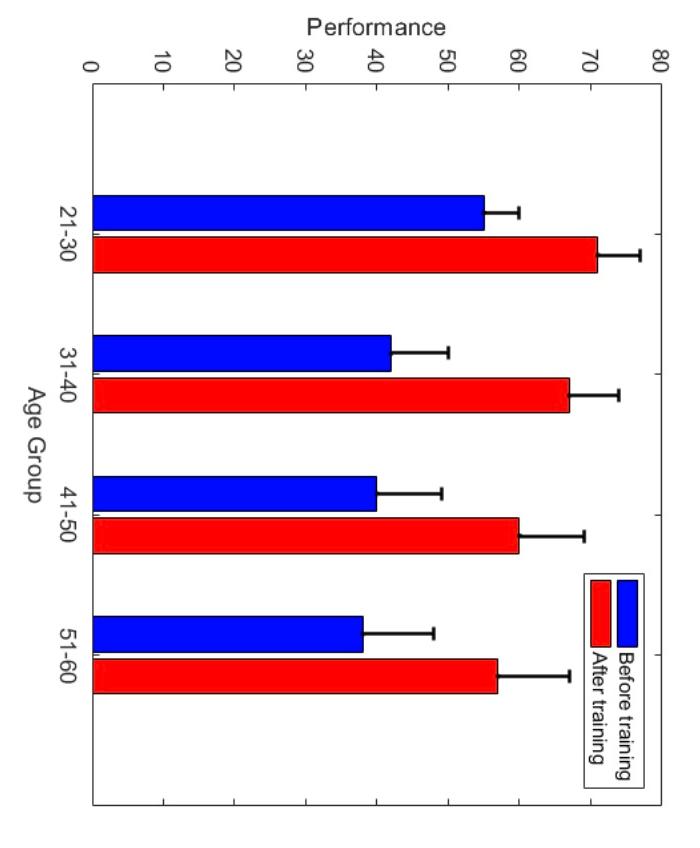
Suppose we have the following data:
Y = [ 55 71; ... 42 67; ... 40 60; ... 38 57 ]; E = [ 5 6; ... 8 7; ... 9 9; ... 10 10 ];
The matrix Y contains outcomes from a learning experiment. The first and second column contain performance observations for four age groups before and after training respectively. The matrix E contains error measurements (i.e., standard error of the mean) that correspond to the values in Y.
Reproduce the figure below using Matlab code and the matrices Y and E. Note that the blue and red bars correspond to the Y values and the length of errorbars correspond to the E values.
Requirements:
1) Your code should reproduce all aspects of the illustration below
2) Your Matlab figure should have error bars that extend upward only
Transcribed image text
Step by Step Solution
There are 3 Steps involved in it
Step: 1

Get Instant Access to Expert-Tailored Solutions
See step-by-step solutions with expert insights and AI powered tools for academic success
Step: 2

Step: 3
Ace Your Homework with AI
Get the answers you need in no time with our AI-driven, step-by-step assistance
Get Started
Focus On Geodatabases In ArcGIS Pro
Authors: David W. Allen
1st Edition
1589484452, 978-1589484450