Question
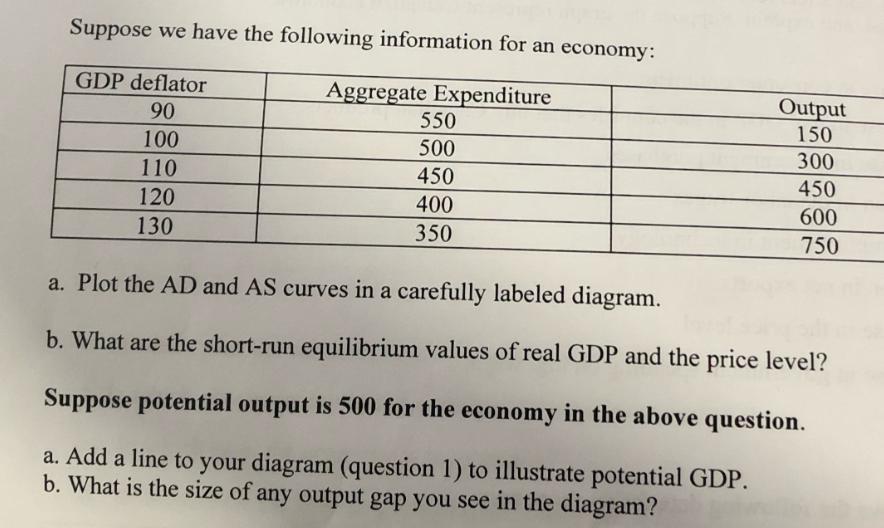
Suppose we have the following information for an economy: GDP deflator 90 100 110 120 130 Aggregate Expenditure 550 500 450 400 350 Output

Suppose we have the following information for an economy: GDP deflator 90 100 110 120 130 Aggregate Expenditure 550 500 450 400 350 Output 150 300 450 600 750 a. Plot the AD and AS curves in a carefully labeled diagram. b. What are the short-run equilibrium values of real GDP and the price level? Suppose potential output is 500 for the economy in the above question. a. Add a line to your diagram (question 1) to illustrate potential GDP. b. What is the size of any output gap you see in the diagram?
Step by Step Solution
3.40 Rating (159 Votes )
There are 3 Steps involved in it
Step: 1
a Plotting the AD and AS curves AD Aggregate Demand curve The AD curve represents the relationship b...
Get Instant Access to Expert-Tailored Solutions
See step-by-step solutions with expert insights and AI powered tools for academic success
Step: 2

Step: 3

Ace Your Homework with AI
Get the answers you need in no time with our AI-driven, step-by-step assistance
Get StartedRecommended Textbook for
The Practice Of Statistics
Authors: Daren S. Starnes, Josh Tabor
6th Edition
978-1319113339
Students also viewed these Finance questions
Question
Answered: 1 week ago
Question
Answered: 1 week ago
Question
Answered: 1 week ago
Question
Answered: 1 week ago
Question
Answered: 1 week ago
Question
Answered: 1 week ago
Question
Answered: 1 week ago
Question
Answered: 1 week ago
Question
Answered: 1 week ago
Question
Answered: 1 week ago
Question
Answered: 1 week ago
Question
Answered: 1 week ago
Question
Answered: 1 week ago
Question
Answered: 1 week ago
Question
Answered: 1 week ago
Question
Answered: 1 week ago
Question
Answered: 1 week ago
Question
Answered: 1 week ago
Question
Answered: 1 week ago
Question
Answered: 1 week ago
Question
Answered: 1 week ago
Question
Answered: 1 week ago
View Answer in SolutionInn App


