Question
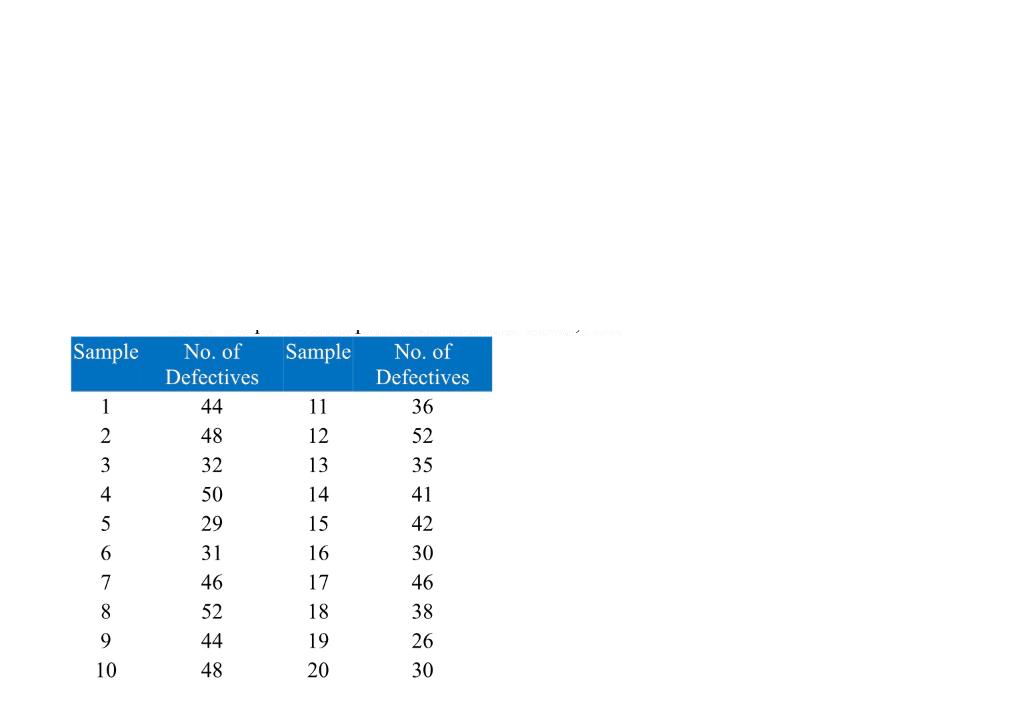
Suppose we wish to construct a control chart for a marche tile population line. We have 20 samples each of size 100. The number of
Suppose we wish to construct a control chart for a marche tile population line. We have 20 samples each of size 100. The number of defectile tiles in each sample is provided in the table below (assume z=3)
11) What is the value corresponding to the centre line (CL) of the p-chart for the above data?
12) What is the lower control limit of the p-chart corresponding to the above data?
13) What is the upper control limit of the p-chart corresponding to the above data?
14) The p-chart for the data is depicted below. Is the process in control or not in control?
a) Process is in control.
b) Process is not in control.
15) Pick the true statements.
a) If a process is in control, it can exhibit assignable variations.
b) If a process is in control, it can exhibit natural or random variations.
c) If a process is not in control, it can exhibit assignable variations.
d) If a process is not in control, it can exhibit natural or random variatiions.

Step by Step Solution
There are 3 Steps involved in it
Step: 1

Get Instant Access to Expert-Tailored Solutions
See step-by-step solutions with expert insights and AI powered tools for academic success
Step: 2

Step: 3

Ace Your Homework with AI
Get the answers you need in no time with our AI-driven, step-by-step assistance
Get Started


