Suppose you are a risk management professional working for Top-Knotch RM - a firm which is located in the Redlands, Queensland. Top-Knotch RM provides consulting services to firms such as airline companies and mining companies on their risk management. Mr Richard Dolan the treasurer of IMine corporation approaches you today (assume it is March 2020 now) to ask you for advice on the financial risk of his company.
IMine corporation is an Australian gold mining company producing gold from Australia's highest grade major gold field in north eastern Australia, with plans to increase its size and valuation over the next few years. IMine is a growth company that aims to a growing cash flow from expanding gold mining operations and the huge capital growth upside of an exploration company seeking to define up to 15 million troy ounces of gold. The company has invested in developing the goldfield, and commenced extracting gold and gold production from its underground mines.
The company's profit and loss is subject to the price of change in gold. The company will benefit US $8,000 for each 1 cent increase in the price per troy ounce of gold sometime in late July 2020. As the market price of gold is quite volatile, the company is considering using some strategies to manage its risk exposure. One way to hedge these exposures is to use futures contracts. There are futures contracts traded on the COMEX division of the Chicago Mercantile Exchange (CME) group. In your report/answers to questions, please devise a hedging strategy IMine corporation.
(1) What kind of futures should IMine use and what position should it take if IMine gold wants to use gold futures to hedge the exposure? Why?
(2) What is the Optimal Hedge Ratio?
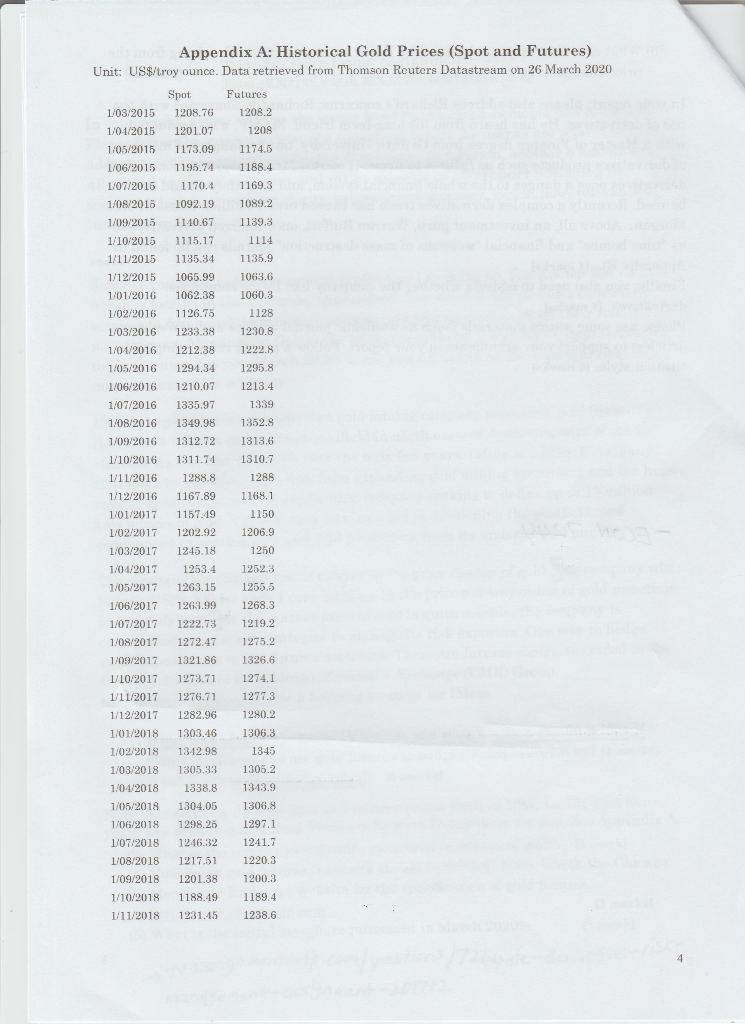
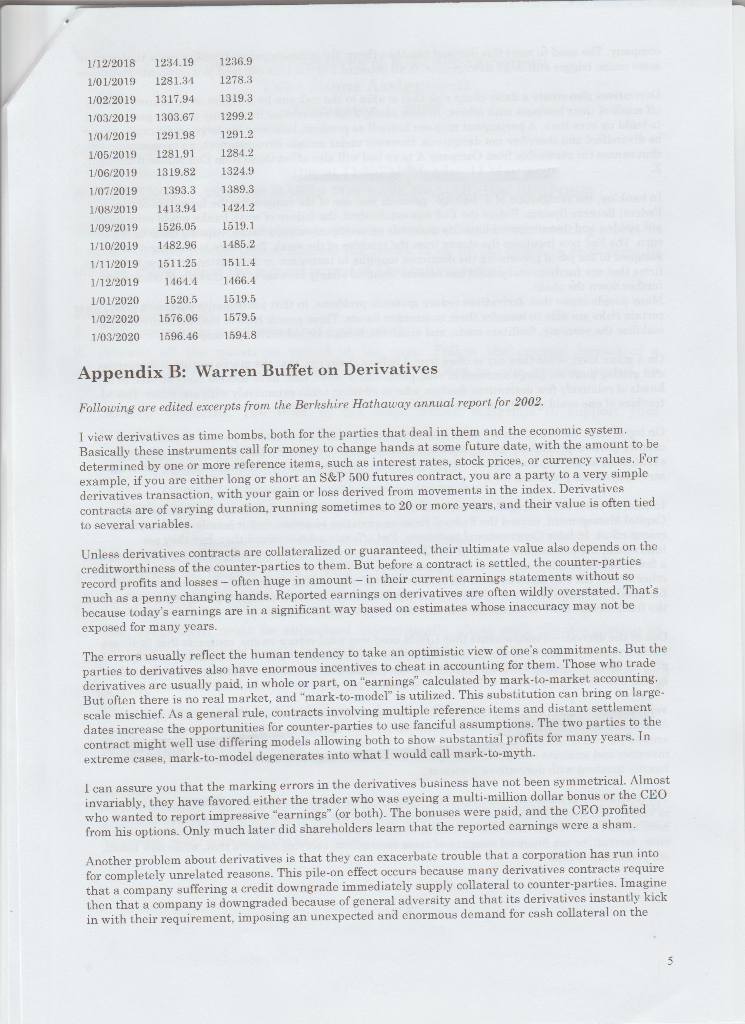
Note that monthly data for spot and futures prices (both is US Dollars has been obtained from Thomson Reuters Datastream for you and is posted below these questions.
(3) What is the company's exposure measured in ounces of gold?
(4) How many gold futures contracts should be traded? Note: check the Chicago Mercantile Exchange website for the specification of gold futures - www.cmegroup.com
(5) What is the initial margin requirement in March 2020?
(6) What are the other major risks faced by IMine corporation apart from the risk arising from the price change in gold?


Appendix A: Historical Gold Prices (Spot and Futures) Unit: US$/troy ounce. Data retrieved from Thomson Reuters Datastream on 26 March 2020 Spot Futures 1/03/2015 1208.76 1208.2 1/04/2015 1201.07 1208 1/05/2015 1173.09 1 174.5 1/06/2015 1195.74 1188.4 1/07/2015 1170,4 1169.3 1/08/2016 1092.19 1089.2 1/09/2015 1140.67 1139.3 1/10/2015 1115.17 1114 1/11/2015 1135.34 1135.9 1/12/2015 1065.99 1063.6 1/01/2016 1062.38 1060.3 1/02/2016 1126.75 1128 1/03/2016 1233.38 1230.8 1/04/2016 1212.38 1222.8 1/05/2016 1294.34 1295.8 1/06/2016 1210.07 1213.4 1/07/2016 1335.97 1339 1/08/2016 1349.98 1352.8 1/09/2016 1312.72 1313.6 1/10/2016 1311.74 1310.7 1/11/2016 1288.8 1288 1/12/2016 1167.89 1168.1 1/01/2017 1157.19 1150 1/02/2017 1202.92 1206.9 1/03/2017 1245.18 1250 1/04/2017 1253.4 1252.3 1/05/2017 1263.15 1255.5 1/06/2017 1263.99 1/07/2017 1222.73 1219.2 1/08/2017 1272.47 1275.2 1/09/2017 1321.86 1326.6 1/10/2017 1273.71 1274.1 1/11/2017 1276.71 1277.3 1/12/2017 1282.96 1280.2 1/01/2018 1303.46 1306.3 1/02/2018 1312.98 1345 1/03/2018 1305,33 1305.2 1/04/2018 1338.8 1343.9 1/05/2018 1304.05 1306.8 1/06/2018 1298.25 1297.1 1/07/2018 1246.32 1241.7 1/08/2018 1217.51 1220.3 1/09/2018 1201.38 1200.3 1/10/2018 1188.49 1189.4 1/11/2018 1231.45 1238.6 1/12/2018 1/01/2019 1/02/2019 1/03/2019 1/04/2019 1/05/2019 1/06/2019 1/07/2019 1/08/2019 1/09/2019 1/10/2019 1/11/2019 1/12/2019 1/01/2020 1/02/2020 1/03/2020 1234.19 1281.31 1317.94 1303.67 1291.98 1281.91 1319.82 1393.3 1413.94 1526.05 1482.96 1511.25 1461.4 1520.5 1676.06 1596.46 1 236.9 1278.3 1319.3 1299.2 1291.2 1284.2 1324.9 1389.3 1424.2 1519.1 1485.2 1511.4 1466.4 1519,5 1579.5 1594.8 Appendix B: Warren Buffet on Derivatives Following are edited excerpts from the Berkshire Hathaway annual report for 2002 I view derivatives as time bombs, both for the parties that deal in them and the economic system. Basically these instruments call for money to change hands at some future date, with the amount to be determined by one or more reference items, such as interest rates, stock prices, or currency values. For example, if you are either long or short an S&P 500 futures contract, you are a party to a very simple derivatives transaction, with your gain or loss derived from movements in the index. Derivatives contracts are of varying duration, running sometimes to 20 or more years, and their value is often tied to several variables. Unless derivatives contracts are collateralized or guaranteed, their ultimate value also depends on the creditworthiness of the counter-parties to them. But before a contract is settled, the counter-parties record profits and losses-often huge in amount - in their current earning statements without so much as a penny changing hands. Reported earnings on derivatives are often wildly overstated. That's because today's earnings are in a significant way based on estimates whose inaccuracy may not be exposed for many years. The errore usually reflect the human tendency to take an optimistic view of one's commitments. But the parties to derivatives also have enormous incentives to cheat in accounting for them. Those who trade derivatives are usually paid, in whole or part, on earnings" calculated by mark-to-market accounting. But often there is no real market, and "mark-to-model" is utilized. This substitution can bring on large- scale mischief. As a general rule, contracts involving multiple reference items and distant settlement dates increase the opportunities for counter-parties to use fanciful assumptions. The two parties to the contract might well use differing models allowing both to show substantial profits for many years. In extreme cases, mark-to-model degenerates into what I would call mark-to-myth. I can assure you that the marking errors in the derivatives business have not been symmetrical. Almost invariably, they have favored either the trader who was eyeing a multi-million dollar bonus or the CEO who wanted to report impressive "earnings" (or both). The bonuses were paid, and the CEO profited from his options. Only much later did shareholders learn that the reported earnings were a sham. Another problem about derivatives is that they can exacerbate trouble that a corporation has run into for completely unrelated reasons. This pile-on effect occurs because many derivatives contracte require that a company suffering a credit downgrade immediately supply collateral to counter-parties. Imagine then that a company is downgraded because of general adversity and that its derivatives instantly kick in with their requirement, imposing an unexpected and enormous demand for cash collateral on the Appendix A: Historical Gold Prices (Spot and Futures) Unit: US$/troy ounce. Data retrieved from Thomson Reuters Datastream on 26 March 2020 Spot Futures 1/03/2015 1208.76 1208.2 1/04/2015 1201.07 1208 1/05/2015 1173.09 1 174.5 1/06/2015 1195.74 1188.4 1/07/2015 1170,4 1169.3 1/08/2016 1092.19 1089.2 1/09/2015 1140.67 1139.3 1/10/2015 1115.17 1114 1/11/2015 1135.34 1135.9 1/12/2015 1065.99 1063.6 1/01/2016 1062.38 1060.3 1/02/2016 1126.75 1128 1/03/2016 1233.38 1230.8 1/04/2016 1212.38 1222.8 1/05/2016 1294.34 1295.8 1/06/2016 1210.07 1213.4 1/07/2016 1335.97 1339 1/08/2016 1349.98 1352.8 1/09/2016 1312.72 1313.6 1/10/2016 1311.74 1310.7 1/11/2016 1288.8 1288 1/12/2016 1167.89 1168.1 1/01/2017 1157.19 1150 1/02/2017 1202.92 1206.9 1/03/2017 1245.18 1250 1/04/2017 1253.4 1252.3 1/05/2017 1263.15 1255.5 1/06/2017 1263.99 1/07/2017 1222.73 1219.2 1/08/2017 1272.47 1275.2 1/09/2017 1321.86 1326.6 1/10/2017 1273.71 1274.1 1/11/2017 1276.71 1277.3 1/12/2017 1282.96 1280.2 1/01/2018 1303.46 1306.3 1/02/2018 1312.98 1345 1/03/2018 1305,33 1305.2 1/04/2018 1338.8 1343.9 1/05/2018 1304.05 1306.8 1/06/2018 1298.25 1297.1 1/07/2018 1246.32 1241.7 1/08/2018 1217.51 1220.3 1/09/2018 1201.38 1200.3 1/10/2018 1188.49 1189.4 1/11/2018 1231.45 1238.6 1/12/2018 1/01/2019 1/02/2019 1/03/2019 1/04/2019 1/05/2019 1/06/2019 1/07/2019 1/08/2019 1/09/2019 1/10/2019 1/11/2019 1/12/2019 1/01/2020 1/02/2020 1/03/2020 1234.19 1281.31 1317.94 1303.67 1291.98 1281.91 1319.82 1393.3 1413.94 1526.05 1482.96 1511.25 1461.4 1520.5 1676.06 1596.46 1 236.9 1278.3 1319.3 1299.2 1291.2 1284.2 1324.9 1389.3 1424.2 1519.1 1485.2 1511.4 1466.4 1519,5 1579.5 1594.8 Appendix B: Warren Buffet on Derivatives Following are edited excerpts from the Berkshire Hathaway annual report for 2002 I view derivatives as time bombs, both for the parties that deal in them and the economic system. Basically these instruments call for money to change hands at some future date, with the amount to be determined by one or more reference items, such as interest rates, stock prices, or currency values. For example, if you are either long or short an S&P 500 futures contract, you are a party to a very simple derivatives transaction, with your gain or loss derived from movements in the index. Derivatives contracts are of varying duration, running sometimes to 20 or more years, and their value is often tied to several variables. Unless derivatives contracts are collateralized or guaranteed, their ultimate value also depends on the creditworthiness of the counter-parties to them. But before a contract is settled, the counter-parties record profits and losses-often huge in amount - in their current earning statements without so much as a penny changing hands. Reported earnings on derivatives are often wildly overstated. That's because today's earnings are in a significant way based on estimates whose inaccuracy may not be exposed for many years. The errore usually reflect the human tendency to take an optimistic view of one's commitments. But the parties to derivatives also have enormous incentives to cheat in accounting for them. Those who trade derivatives are usually paid, in whole or part, on earnings" calculated by mark-to-market accounting. But often there is no real market, and "mark-to-model" is utilized. This substitution can bring on large- scale mischief. As a general rule, contracts involving multiple reference items and distant settlement dates increase the opportunities for counter-parties to use fanciful assumptions. The two parties to the contract might well use differing models allowing both to show substantial profits for many years. In extreme cases, mark-to-model degenerates into what I would call mark-to-myth. I can assure you that the marking errors in the derivatives business have not been symmetrical. Almost invariably, they have favored either the trader who was eyeing a multi-million dollar bonus or the CEO who wanted to report impressive "earnings" (or both). The bonuses were paid, and the CEO profited from his options. Only much later did shareholders learn that the reported earnings were a sham. Another problem about derivatives is that they can exacerbate trouble that a corporation has run into for completely unrelated reasons. This pile-on effect occurs because many derivatives contracte require that a company suffering a credit downgrade immediately supply collateral to counter-parties. Imagine then that a company is downgraded because of general adversity and that its derivatives instantly kick in with their requirement, imposing an unexpected and enormous demand for cash collateral on the


