Question
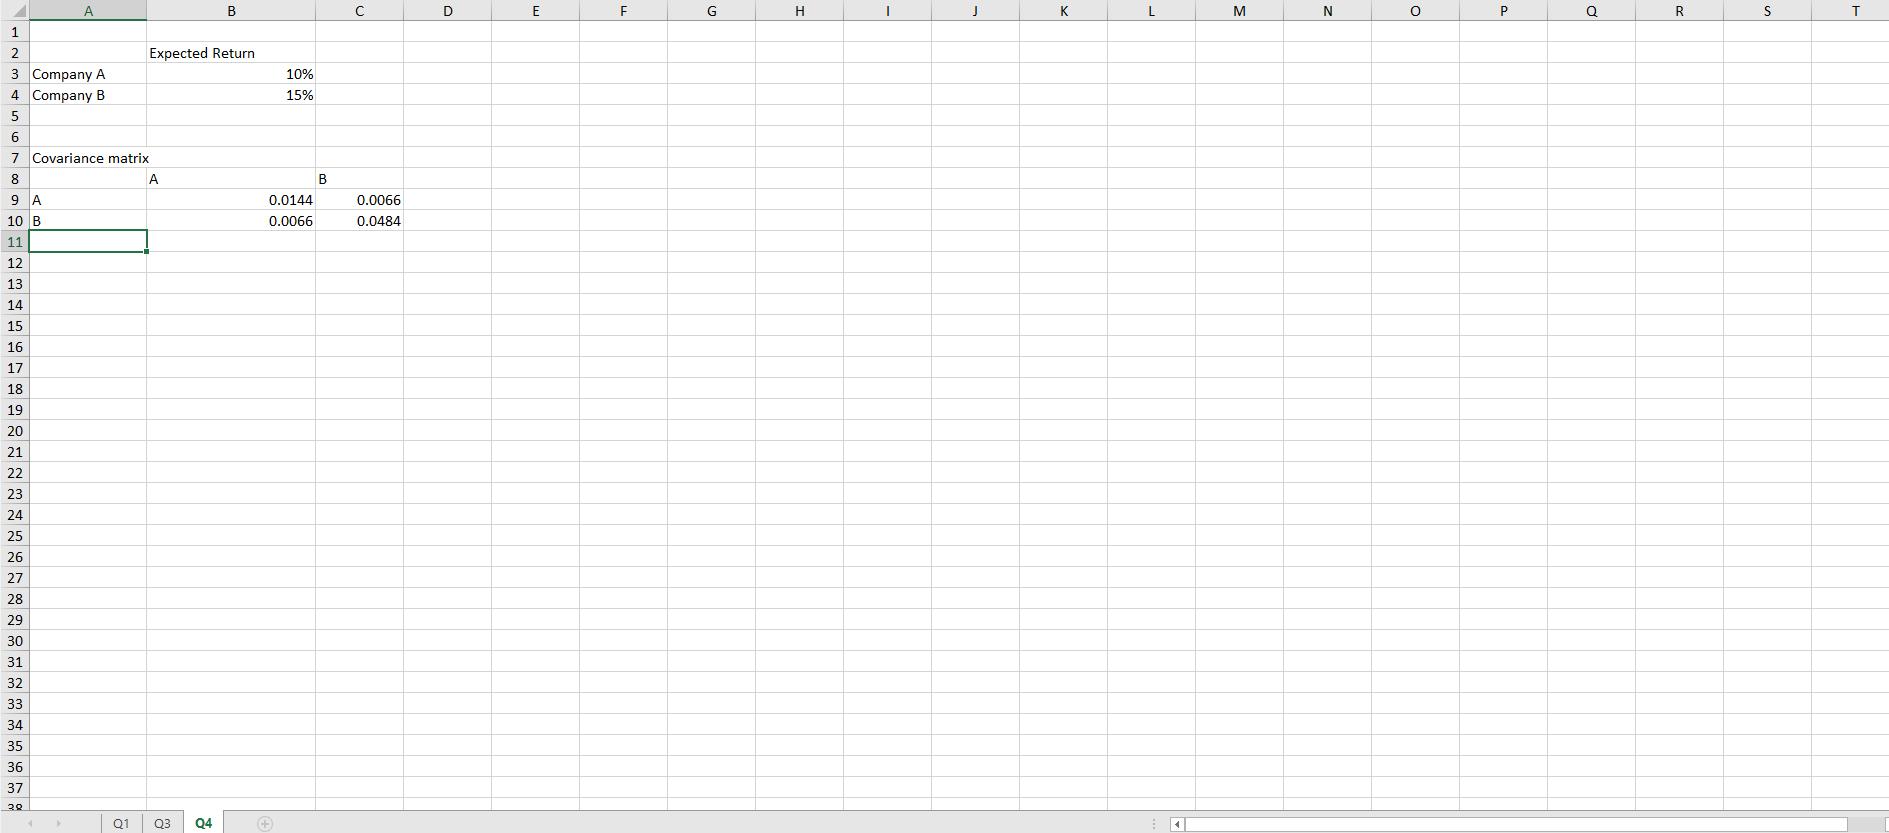
Suppose you are forming a portfolio with Company A and Company B, which have expected returns and covariance matrix as in Q4 tab of hw2.xls.
Suppose you are forming a portfolio with Company A and Company B, which have expected returns and covariance matrix as in “Q4” tab of hw2.xls.
a. Construct portfolios consisting of the two stocks with a wide range of portfolio weights (e.g., 10%:90%, 20%:80%, etc.) Plot the portfolios on a chart with expected return on the y-axis and volatility on the x-axis.
b. What are the portfolio weights of your minimum-variance portfolio?
c. What range of portfolio weights produces inefficient portfolios?
d. Now, suppose you can save/borrow at the risk-free rate of 3%. What is the expected return and volatility of the tangent portfolio, and what are its portfolio weights?

1 1 2 11 12 13 14 15 16 17 18 19 20 21 22 23 24 25 26 27 28 29 30 31 32 33 34 3 Company A 4 Company B 5 6 7 Covariance matrix 8 9 A 10 B 35 36 37 30 A Y Expected Return A Q1 Q3 B Q4 10% 15% 0.0144 0.0066 + B C 0.0066 0.0484 D E F G H K L 4 M N O P Q R S T
Step by Step Solution
3.48 Rating (168 Votes )
There are 3 Steps involved in it
Step: 1
a Constructing Portfolios and Plotting Chart Expected returns and volatilities for several p...
Get Instant Access to Expert-Tailored Solutions
See step-by-step solutions with expert insights and AI powered tools for academic success
Step: 2

Step: 3

Ace Your Homework with AI
Get the answers you need in no time with our AI-driven, step-by-step assistance
Get Started


