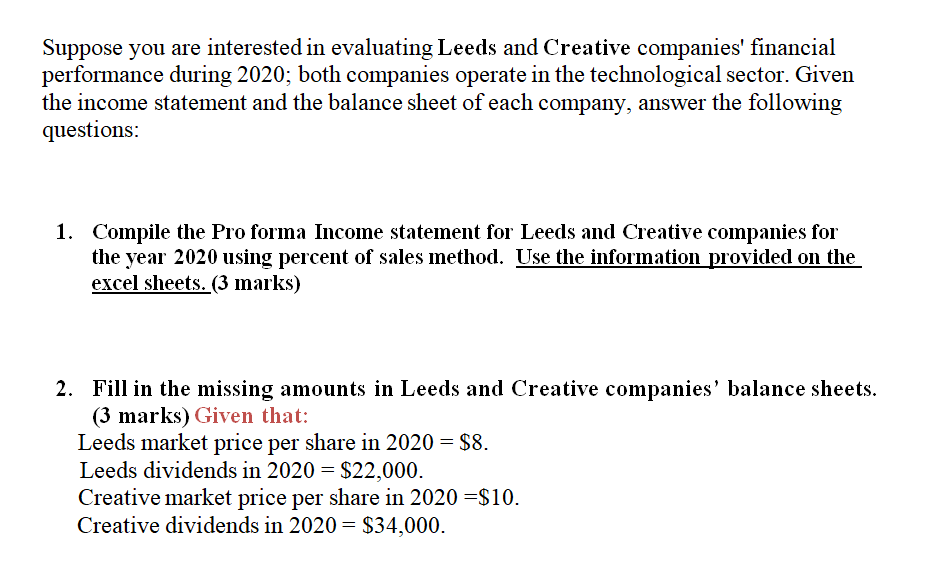
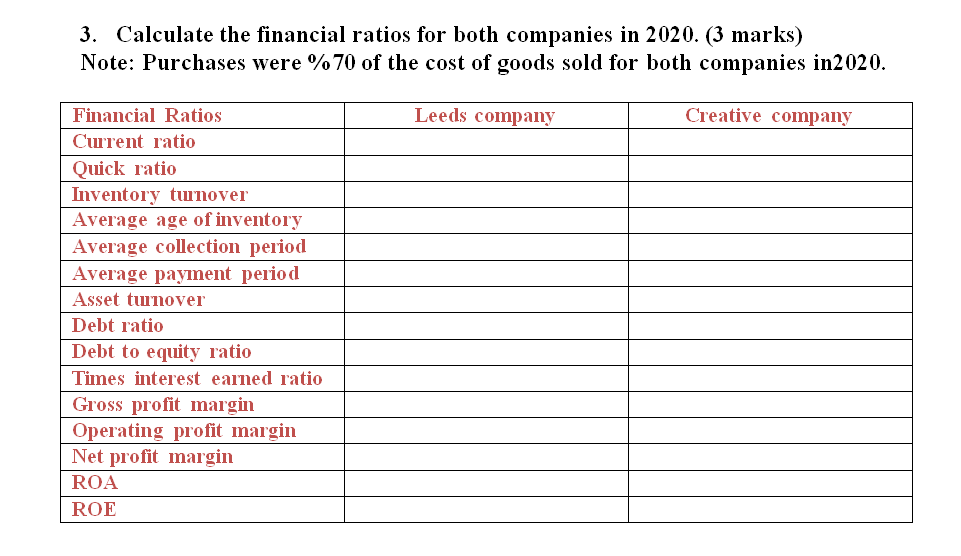
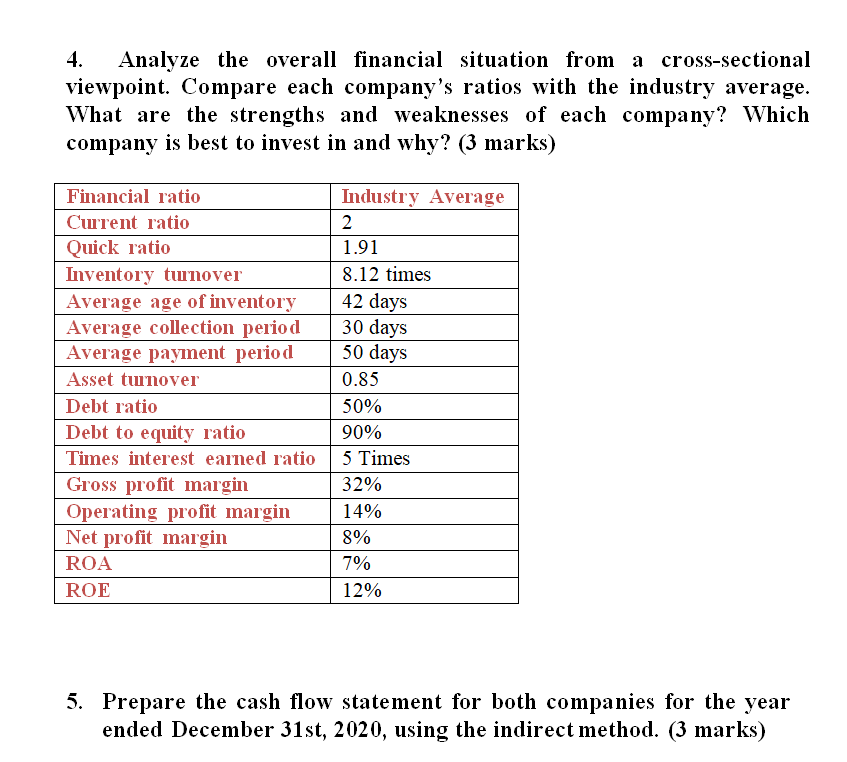
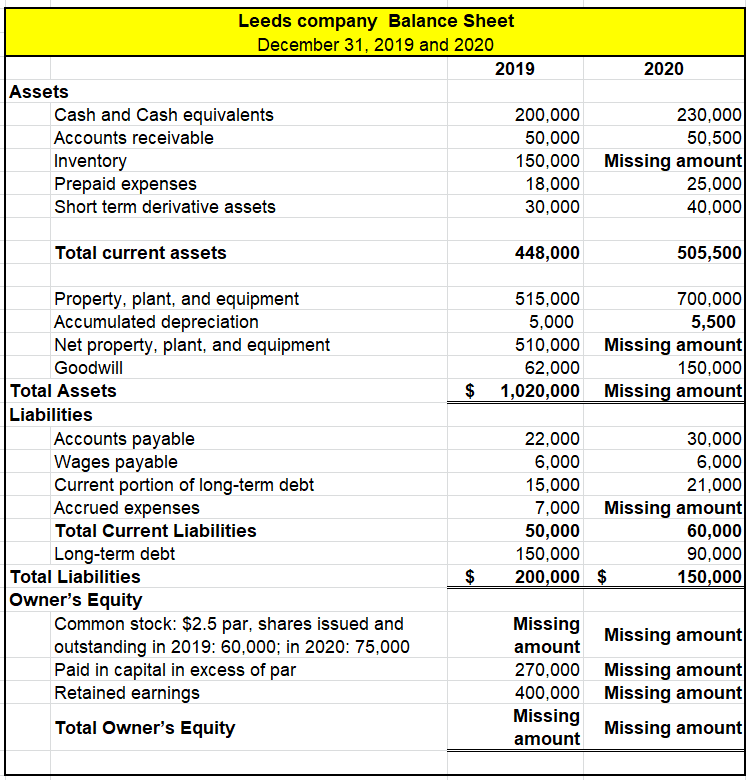
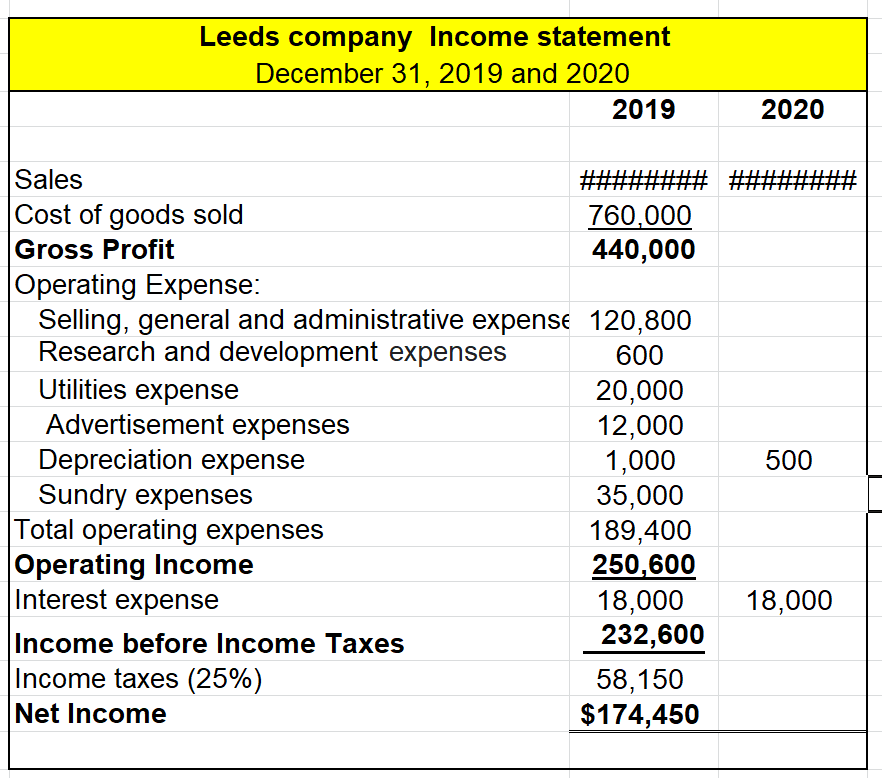
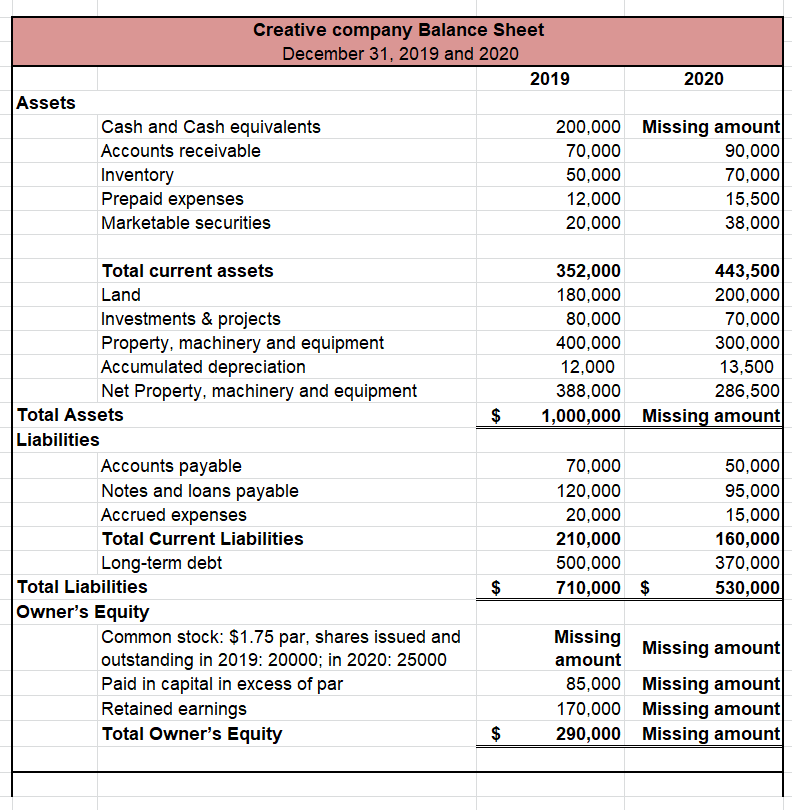
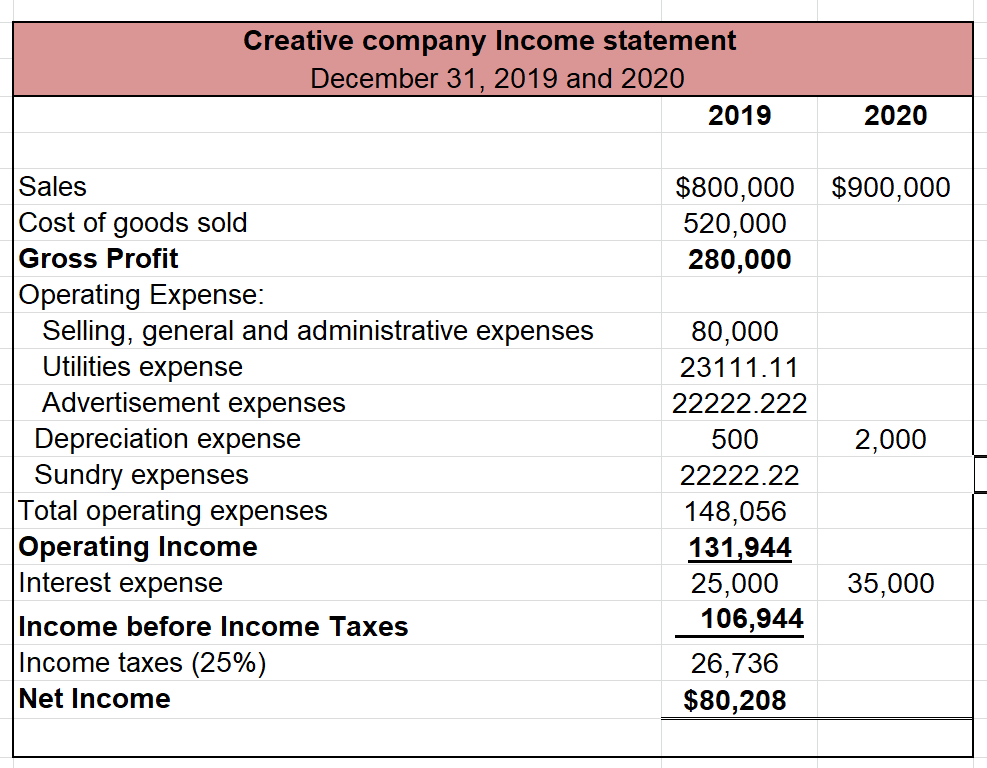
Suppose you are interested in evaluating Leeds and Creative companies' financial performance during 2020; both companies operate in the technological sector. Given the income statement and the balance sheet of each company, answer the following questions: 1. Compile the Pro forma Income statement for Leeds and Creative companies for the year 2020 using percent of sales method. Use the information provided on the excel sheets. (3 marks) 2. Fill in the missing amounts in Leeds and Creative companies' balance sheets. (3 marks) Given that: Leeds market price per share in 2020 = $8. Leeds dividends in 2020 = $22,000. Creative market price per share in 2020 =$10. Creative dividends in 2020 = $34,000. 3. Calculate the financial ratios for both companies in 2020. (3 marks) Note: Purchases were %70 of the cost of goods sold for both companies in 2020. Leeds company Creative company Financial Ratios Current ratio Quick ratio Inventory turnover Average age of inventory Average collection period Average payment period Asset turnover Debt ratio Debt to equity ratio Times interest earned ratio Gross profit margin Operating profit margin Net profit margin ROA ROE 4. Analyze the overall financial situation from a cross-sectional viewpoint. Compare each company's ratios with the industry average. What are the strengths and weaknesses of each company? Which company is best to invest in and why? (3 marks) Financial ratio Current ratio Quick ratio Inventory turnover Average age of inventory Average collection period Average payment period Asset turnover Debt ratio Debt to equity ratio Times interest earned ratio Gross profit margin Operating profit margin Net profit margin ROA ROE Industry Average 2 1.91 8.12 times 42 days 30 days 50 days 0.85 50% 90% 5 Times 32% 14% 8% 7% 12% 5. Prepare the cash flow statement for both companies for the year ended December 31st, 2020, using the indirect method. (3 marks) Leeds company Balance Sheet December 31, 2019 and 2020 2019 2020 Assets Cash and Cash equivalents 200,000 230,000 Accounts receivable 50,000 50,500 Inventory 150,000 Missing amount Prepaid expenses 18,000 25,000 Short term derivative assets 30,000 40,000 Total current assets 448,000 505,500 515,000 700,000 5,000 5,500 510,000 Missing amount 62,000 150,000 1,020,000 Missing amount $ Property, plant, and equipment Accumulated depreciation Net property, plant, and equipment Goodwill Total Assets Liabilities Accounts payable Wages payable Current portion of long-term debt Accrued expenses Total Current Liabilities Long-term debt Total Liabilities Owner's Equity Common stock: $2.5 par, shares issued and outstanding in 2019: 60,000; in 2020: 75,000 Paid in capital in excess of par Retained earnings Total Owner's Equity 22,000 30,000 6,000 6,000 15,000 21,000 7,000 Missing amount 50,000 60,000 150,000 90,000 200,000 $ 150,000 $ Missing amount Missing amount 270,000 Missing amount 400,000 Missing amount Missing amount Missing amount Leeds company Income statement December 31, 2019 and 2020 2019 2020 Sales Cost of goods sold 760,000 Gross Profit 440,000 Operating Expense: Selling, general and administrative expense 120,800 Research and development expenses 600 Utilities expense 20,000 Advertisement expenses 12,000 Depreciation expense 1,000 Sundry expenses 35,000 Total operating expenses 189,400 Operating Income 250,600 Interest expense 18,000 Income before Income Taxes 232,600 Income taxes (25%) 58,150 Net Income $174,450 500 18,000 Creative company Balance Sheet December 31, 2019 and 2020 2019 2020 Assets Cash and Cash equivalents Accounts receivable Inventory Prepaid expenses Marketable securities 200,000 Missing amount 70,000 90,000 50,000 70,000 12,000 15,500 20,000 38,000 352,000 443,500 180,000 200,000 80,000 70,000 400,000 300,000 12,000 13,500 388,000 286,500 1,000,000 Missing amount $ Total current assets Land Investments & projects Property, machinery and equipment Accumulated depreciation Net Property, machinery and equipment Total Assets Liabilities Accounts payable Notes and loans payable Accrued expenses Total Current Liabilities Long-term debt Total Liabilities Owner's Equity Common stock: $1.75 par, shares issued and outstanding in 2019: 20000; in 2020: 25000 Paid in capital in excess of par Retained earnings Total Owner's Equity 70,000 120,000 20,000 210,000 500,000 710,000 $ 50,000 95,000 15,000 160,000 370,000 530,000 $ Missing Missing amount amount 85,000 Missing amount 170,000 Missing amount 290,000 Missing amount $ Creative company Income statement December 31, 2019 and 2020 2019 2020 $800,000 $900,000 520,000 280,000 Sales Cost of goods sold Gross Profit Operating Expense: Selling, general and administrative expenses Utilities expense Advertisement expenses Depreciation expense Sundry expenses Total operating expenses Operating Income Interest expense Income before Income Taxes Income taxes (25%) Net Income 2,000 80,000 23111.11 22222.222 500 22222.22 148,056 131,944 25,000 106,944 26,736 $80,208 35,000 Suppose you are interested in evaluating Leeds and Creative companies' financial performance during 2020; both companies operate in the technological sector. Given the income statement and the balance sheet of each company, answer the following questions: 1. Compile the Pro forma Income statement for Leeds and Creative companies for the year 2020 using percent of sales method. Use the information provided on the excel sheets. (3 marks) 2. Fill in the missing amounts in Leeds and Creative companies' balance sheets. (3 marks) Given that: Leeds market price per share in 2020 = $8. Leeds dividends in 2020 = $22,000. Creative market price per share in 2020 =$10. Creative dividends in 2020 = $34,000. 3. Calculate the financial ratios for both companies in 2020. (3 marks) Note: Purchases were %70 of the cost of goods sold for both companies in 2020. Leeds company Creative company Financial Ratios Current ratio Quick ratio Inventory turnover Average age of inventory Average collection period Average payment period Asset turnover Debt ratio Debt to equity ratio Times interest earned ratio Gross profit margin Operating profit margin Net profit margin ROA ROE 4. Analyze the overall financial situation from a cross-sectional viewpoint. Compare each company's ratios with the industry average. What are the strengths and weaknesses of each company? Which company is best to invest in and why? (3 marks) Financial ratio Current ratio Quick ratio Inventory turnover Average age of inventory Average collection period Average payment period Asset turnover Debt ratio Debt to equity ratio Times interest earned ratio Gross profit margin Operating profit margin Net profit margin ROA ROE Industry Average 2 1.91 8.12 times 42 days 30 days 50 days 0.85 50% 90% 5 Times 32% 14% 8% 7% 12% 5. Prepare the cash flow statement for both companies for the year ended December 31st, 2020, using the indirect method. (3 marks) Leeds company Balance Sheet December 31, 2019 and 2020 2019 2020 Assets Cash and Cash equivalents 200,000 230,000 Accounts receivable 50,000 50,500 Inventory 150,000 Missing amount Prepaid expenses 18,000 25,000 Short term derivative assets 30,000 40,000 Total current assets 448,000 505,500 515,000 700,000 5,000 5,500 510,000 Missing amount 62,000 150,000 1,020,000 Missing amount $ Property, plant, and equipment Accumulated depreciation Net property, plant, and equipment Goodwill Total Assets Liabilities Accounts payable Wages payable Current portion of long-term debt Accrued expenses Total Current Liabilities Long-term debt Total Liabilities Owner's Equity Common stock: $2.5 par, shares issued and outstanding in 2019: 60,000; in 2020: 75,000 Paid in capital in excess of par Retained earnings Total Owner's Equity 22,000 30,000 6,000 6,000 15,000 21,000 7,000 Missing amount 50,000 60,000 150,000 90,000 200,000 $ 150,000 $ Missing amount Missing amount 270,000 Missing amount 400,000 Missing amount Missing amount Missing amount Leeds company Income statement December 31, 2019 and 2020 2019 2020 Sales Cost of goods sold 760,000 Gross Profit 440,000 Operating Expense: Selling, general and administrative expense 120,800 Research and development expenses 600 Utilities expense 20,000 Advertisement expenses 12,000 Depreciation expense 1,000 Sundry expenses 35,000 Total operating expenses 189,400 Operating Income 250,600 Interest expense 18,000 Income before Income Taxes 232,600 Income taxes (25%) 58,150 Net Income $174,450 500 18,000 Creative company Balance Sheet December 31, 2019 and 2020 2019 2020 Assets Cash and Cash equivalents Accounts receivable Inventory Prepaid expenses Marketable securities 200,000 Missing amount 70,000 90,000 50,000 70,000 12,000 15,500 20,000 38,000 352,000 443,500 180,000 200,000 80,000 70,000 400,000 300,000 12,000 13,500 388,000 286,500 1,000,000 Missing amount $ Total current assets Land Investments & projects Property, machinery and equipment Accumulated depreciation Net Property, machinery and equipment Total Assets Liabilities Accounts payable Notes and loans payable Accrued expenses Total Current Liabilities Long-term debt Total Liabilities Owner's Equity Common stock: $1.75 par, shares issued and outstanding in 2019: 20000; in 2020: 25000 Paid in capital in excess of par Retained earnings Total Owner's Equity 70,000 120,000 20,000 210,000 500,000 710,000 $ 50,000 95,000 15,000 160,000 370,000 530,000 $ Missing Missing amount amount 85,000 Missing amount 170,000 Missing amount 290,000 Missing amount $ Creative company Income statement December 31, 2019 and 2020 2019 2020 $800,000 $900,000 520,000 280,000 Sales Cost of goods sold Gross Profit Operating Expense: Selling, general and administrative expenses Utilities expense Advertisement expenses Depreciation expense Sundry expenses Total operating expenses Operating Income Interest expense Income before Income Taxes Income taxes (25%) Net Income 2,000 80,000 23111.11 22222.222 500 22222.22 148,056 131,944 25,000 106,944 26,736 $80,208 35,000