

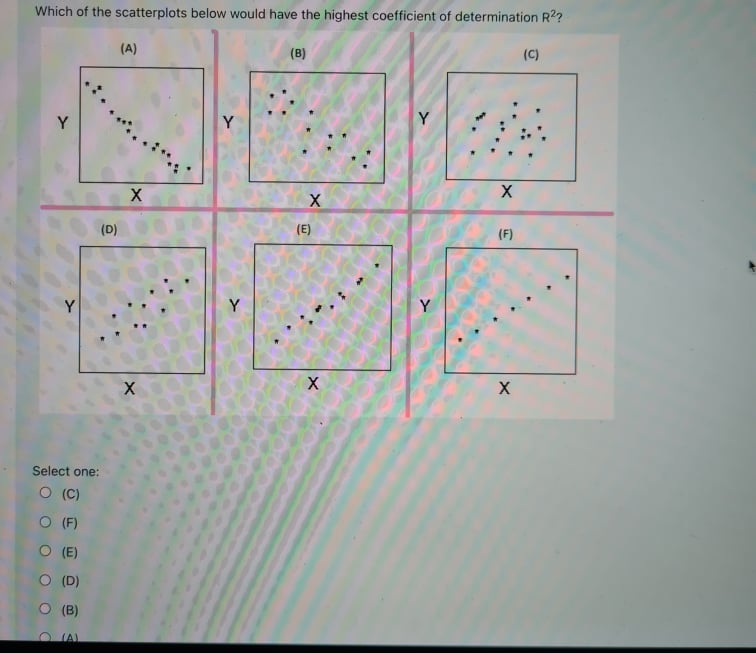
Question
Suppose you do a simpleregression were you predict the number of sales of cold drinks( y ) using the variabletemperature in degrees Celsius ( x
Suppose you do a simpleregression were you predict the number of sales of
cold drinks( y )
using the variabletemperature in degrees Celsius ( x )
Also Suppose you obtain the regression output below
coefficient standard error
intercept 100 10
temperature 3 1
So the regression equation is y=100+3x
What is the equation of the regression line
Select one:
a.
number of sales=-100+2price-3temperature
b.
100+3= 103
c.
number of sales=100+3temperature
d.
None of the choices are correct
e.
Intercept=100-2price+3temperature
2.Consider the followingtwo way table that summarizes two variables in a dataset
no yes Total
New version 4956 5044 10000
old version 5044 4956 10000
The variables are "which version of the product? old or new" and "would they buy it? yes or no"
use thep-value calculatorto find find the p-value that measures evidence for the claim thatthere is a relationship between variables.
click here for a guide for using the p-value calculator
You just need to enter the p-value , but it is useful to understand that the p-value is based on the test stat which is a zscore if the difference between population proportions is 0
in this case that test stat is 1.2445079348883if the test stat is correct then the p-value is correct.
3.Consider the following data set
At the Sydney store a sample of 100 customers spent an average of $2906 with standard deviation $60
and at the Melbourne store a sample of 100 customers spent an average of $2904 with standard deviation $80
What is the p-value for testing if there is a difference between means
use software such as
http://www.usablestats.com/calcs/2samplet&summary=1
click here for a guideto usigng the webpage
or use the p-value calculator
guide tousing the p-value calculator
Click here for a guide for using the p-value calculator
if you enter the numbers correctly the test stat should be 0.2
There are manyp-values in the output, Always use the first p-value in the output ,
4.Be careful with this question, you must tick every correct option
Compare and contrast both cases below, use thep-value calculator
click here for a guide for using the p-value calculator
CASE1
group 1 group 2
mean 101.47 99.51
standard deviation 30 40
sample size 100 100
Test stat =0.392(Use a computer to verify this test stat, if the test stat is correct then thep-value is correct)
CASE 2
group 1 group 2
mean 101.47 99.51
standard deviation 30 40
sample size 400 400
Test stat =0.784(Use a computer to verify this test stat, if the test stat is correct then thep-value is correct)
a.
the sample proportion in group 1 is11.97
b.
for case 1 the pvalue is10.35
c.
for case 1 the pvalue is0.70
d.
For case 2 the pvalue is =0.63
e.
For case 2 the pvalue is =0.43
f.
When you compare case 1 with case 2, case 2 has a larger sample size so there is more evidence that the population means are different so the p-value is lower
g.
When you compare case 1 with case 2, case 2 has a larger sample size so there is more evidence that the population means are different so the p-value is higher
5.Be careful with this question, you must tick every correct option
You need to compare 2 different cases below, note that in the second case there
is a larger difference between the means.
CASE1
group 1 group 2
mean 1456.8 1450
standard deviation 80 60
sample size 100 100
Test stat for two sample t test0.68
verify this using a computer also calculate the pvalues for testing the claim there is a difference.
CASE 2
group 1 group 2
mean 1463.6 1450
standard deviation 80 60
sample size 100 100
Test stat for two sample t test1.36
verify this using a computer also calculate the pvalue for testing if there is a difference.
a.
the sample proportion in group 1 is18.48
b.
For case 2 the pvalue is 0.37
c.
For case 1 the pvalue is 0.50
d.
For case 2 the pvalue is 0.18
e.
For case 2 the pvalue is 0.38
f.
When you compare case 1 with case 2, case 2 has a bigger difference between the means so the p-value is smaller
g.
When you compare case 1 with case 2, case 2 has a larger sample size so there is more evidence that the population means are different so the p-value is higher
6.Be careful with question select all correct options
a.
phat1-phat2 measures the relationship between 2 categorical variables. It can be used to compare cases, the case with phat1-phat2 furthest from 0 has the strongest relationship
b.
r measures the relationship between 2 quantitative variables. It can be used to compare cases, the case with r furthest from 0 has the strongest relationship
c.
xbar1-xbar2 measures the relationship between a quantitative variable and a categoricalvariable. It can be used to compare cases, the case with xbar1-xbar2 furthest from 0 has the strongest relationship
7.Suppose the you are investigating the relationship between 2 categorical variables and the 95% confidence interval for p1-p2 is between 0.2 and 0.3 and the corresponding Pvalue is 0.004
a.
There is a strong evidence ofa relationship , p1 is significantly higher than p2
b.
There is not strong evidence of a relationship
8.Suppose the you are investigating the relationship between 2 categorical variables and the 95% confidence interval for p1-p2 is between -0.1 and 0.2 and the corresponding Pvalue is 0.4
a.
There is not strong evidence of a relationship
b.
There is a strong evidence ofa relationship
9.Some market research was done on two versions of a product, For each version of the productdiscuss if there is enough evidence of the claim
"there is a relationship between the variables "gender: Male or female?"
and "would they buy the product?"
Productversion 1sample summary
Would buy Would not buy Total Sample proportion that would buy
Male 60 40 100 0.6
Female 50 50 100 0.5
phat1-phat2= 0.6-0.5=0.1
An App will tell you that you are 95% confident p1-p2 is between -0.03 and 0.23 and the corresponding Pvalue is0.16
Productversion 2 sample summary
Would buy Would not buy Total Sample proportion that would buy
Male 70 30 100 0.7
Female. 50 50 100 0.5
phat1-phat2= 0.7-0.5=0.2
An App will tell you that you are 95% confident p1-p2 is between 0.06 and 0.34 and the corresponding Pvalue is 0.04
Be careful with this question select all of the correct answers
a.
In thesample using version 1 of the product a higher proportion of males like the product, however there is not strong evidence that males have a higher proportion if you consider the whole population
b.
In the sample using version 1 of the product a higher proportion of males like the product, and there isstrong evidence that males have a higher proportion if you consider the whole population
c.
In the sample using version 2 of the product a higher proportion of males like the product, however there is not strong evidence that males have a higher proportion if you consider the whole population
d.
In the sample using version 2 of the product a higher proportion of males like the product, however therestrong evidence that males have a higher proportion if you consider the whole population
9.Some market research was done on two versions of a product, For each version of the productdiscuss if there is enough evidence of the claim
"there is a relationship between the variables "gender: Male or female?"
and "would they buy the product?"
Productversion1 sample summary
Would buy. Would not buy. total Sample proportion that would buy
Male. 70 30 100 0.7
Female. 50 50 100 0.5
phat1-phat2= 0.7-0.5=0.2
An App will tell you that you are 95% confident p1-p2 is between 0.06 and 0.34 and the corresponding Pvalue is 0.04
Productversion1 sample summary
Would buy Would not buy Total Sample proportion that would buy
Male 28 12 40 0.7
Female 20 20 40 0.5
phat1-phat2= 0.7-0.5=0.2
An App will tell you that you are 95% confident p1-p2 is between -0.01 and 0.41 and the corresponding Pvalue is 0.068
Be careful with this question select all of the correct answers
a.
In the sample using version 2 of the product a higher proportion of males like the product, however therestrong evidence that males have a higher proportion if you consider the whole population
b.
In the sample using version 1 of the product a higher proportion of males like the product, and there isstrong evidence that males have a higher proportion if you consider the whole population
c.
In thesample using version 1 of the product a higher proportion of males like the product, however there is not strong evidence that males have a higher proportion if you consider the whole population
d.
In the sample using version 2 of the product a higher proportion of males like the product, however there is not strong evidence that males have a higher proportion if you consider the whole population
1.What role do principles and values play in understanding who owns the intellectual property that emerges in the workplace?
2.In terms of ethical issue intensity, how would you value intellectual property issues in the workplace from having a low intensity to high intensity?
3.What role does opportunity play in supporting intellectual property rights and standards in the workplace, particularly as it relates to software and licenses?
Step by Step Solution
There are 3 Steps involved in it
Step: 1

Get Instant Access to Expert-Tailored Solutions
See step-by-step solutions with expert insights and AI powered tools for academic success
Step: 2

Step: 3
Ace Your Homework with AI
Get the answers you need in no time with our AI-driven, step-by-step assistance
Get Started
Logic And Structure
Authors: Dirk Van Dalen
5th Edition
1447145585, 9781447145585