Answered step by step
Verified Expert Solution
Question
1 Approved Answer
Suppose you have data on child food intake and school attendance for a large number of schoolchildren aged 6-7 and living in rural India.


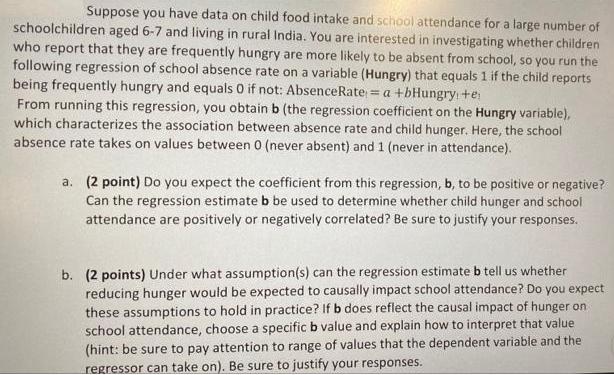
Suppose you have data on child food intake and school attendance for a large number of schoolchildren aged 6-7 and living in rural India. You are interested in investigating whether children who report that they are frequently hungry are more likely to be absent from school, so you run the following regression of school absence rate on a variable (Hungry) that equals 1 if the child reports being frequently hungry and equals 0 if not: AbsenceRate = a +bHungry +e From running this regression, you obtain b (the regression coefficient on the Hungry variable), which characterizes the association between absence rate and child hunger. Here, the school absence rate takes on values between 0 (never absent) and 1 (never in attendance). a. (2 point) Do you expect the coefficient from this regression, b, to be positive or negative? Can the regression estimate b be used to determine whether child hunger and school attendance are positively or negatively correlated? Be sure to justify your responses. b. (2 points) Under what assumption(s) can the regression estimate b tell us whether reducing hunger would be expected to causally impact school attendance? Do you expect these assumptions to hold in practice? If b does reflect the causal impact of hunger on school attendance, choose a specific b value and explain how to interpret that value (hint: be sure to pay attention to range of values that the dependent variable and the regressor can take on). Be sure to justify your responses. Suppose that you discover a colleague has run a randomized trial in a particularly poor area of rural Kenya. In this setting, all schoolchildren initially reported being hungry frequently (i.e., their measure of Hungry was equal to 1), but your colleague then randomly provided free meals to half of the children so that they were no longer frequently hungry. After implementing this intervention, your colleague estimates the same AbsenceRate = a + bHungry +e regression. However, the regression coefficient b that your colleague estimates is very different from your estimate of the coefficient b. C. (3 points) Summarize the argument presented in Duflo et al. (2008) and in Lecture 4 regarding how randomization solves the selection bias problem. Then, given the differing b estimates, explain which estimate is more likely to reflect the causal impact of hunger on school attendance. Does the fact that children randomly assigned to the free meal treatment subsequently report spending more time helping with tasks around the house affect your response? Why or why not? d. (2 points) Provide two explanations for why the b estimates from the two studies (in India and Kenya) would not be expected to be identical even if each reflected the causal impact of hunger on school attendance in the given study setting.
Step by Step Solution
★★★★★
3.45 Rating (161 Votes )
There are 3 Steps involved in it
Step: 1
a I would expect the coefficient from this regression b to be negative This is because if children a...
Get Instant Access to Expert-Tailored Solutions
See step-by-step solutions with expert insights and AI powered tools for academic success
Step: 2

Step: 3

Ace Your Homework with AI
Get the answers you need in no time with our AI-driven, step-by-step assistance
Get Started


