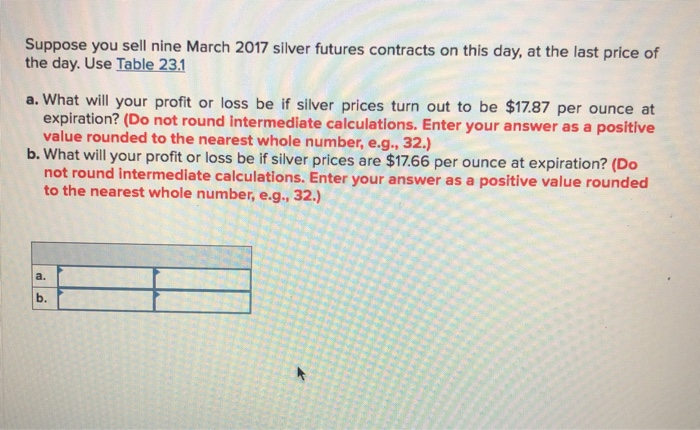
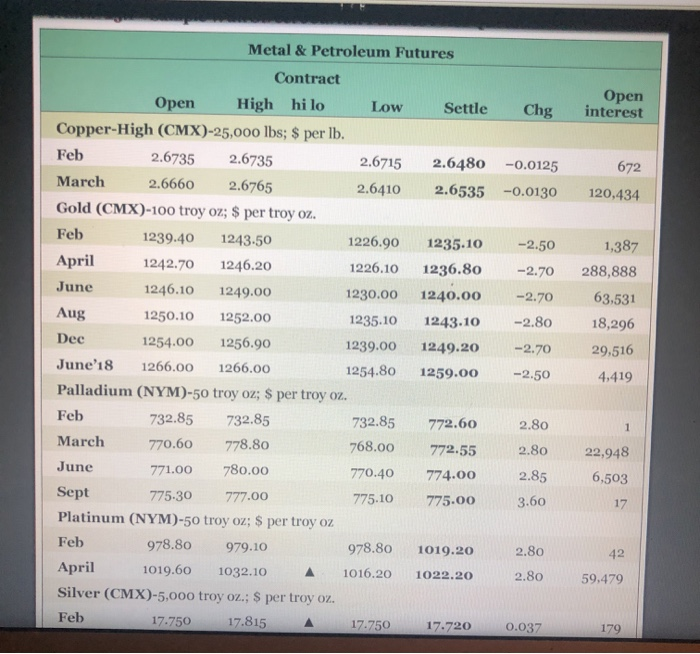
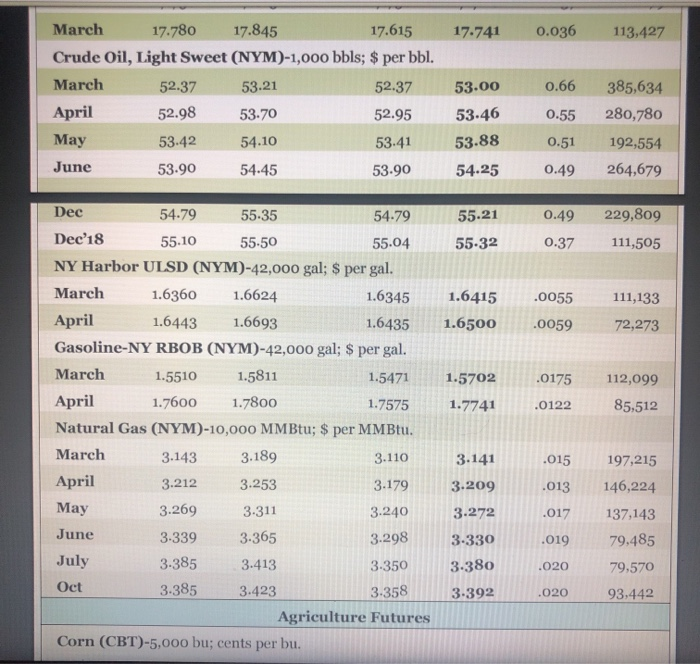
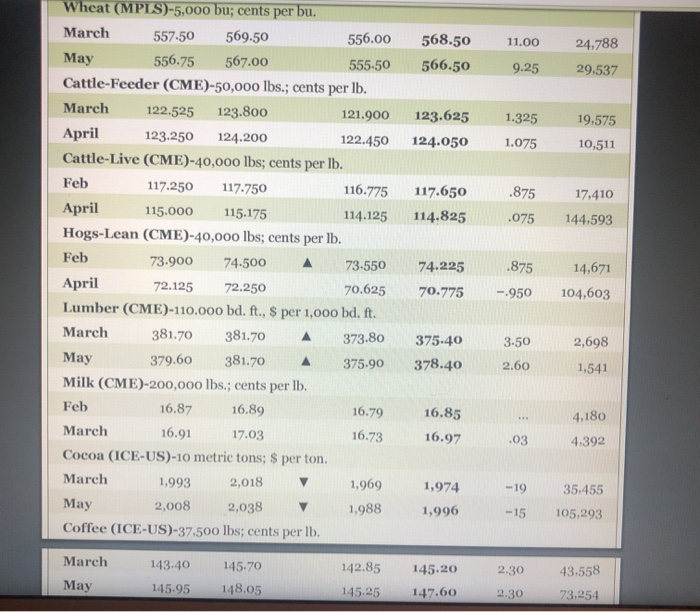
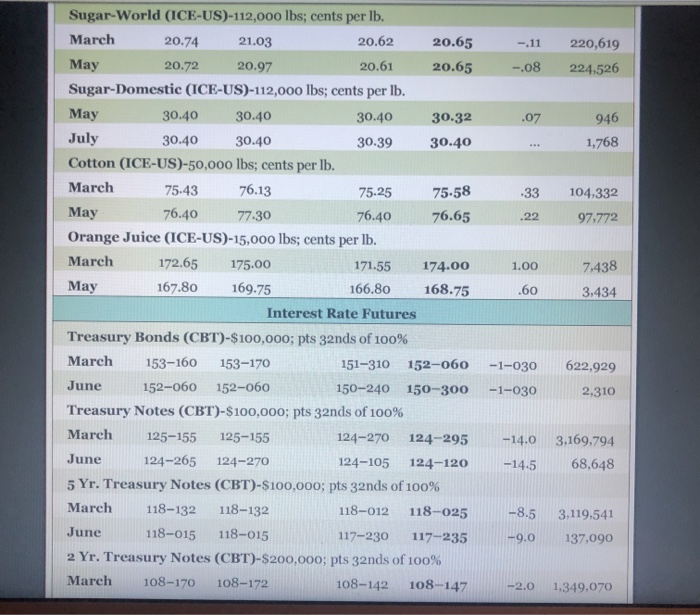
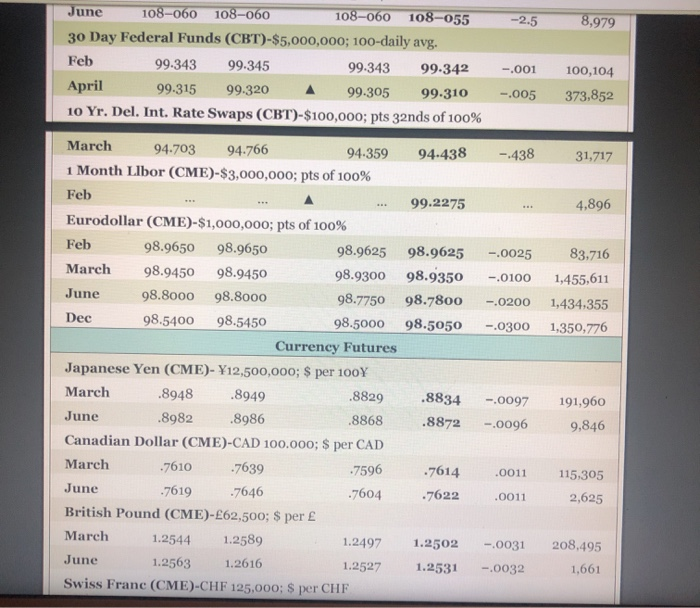
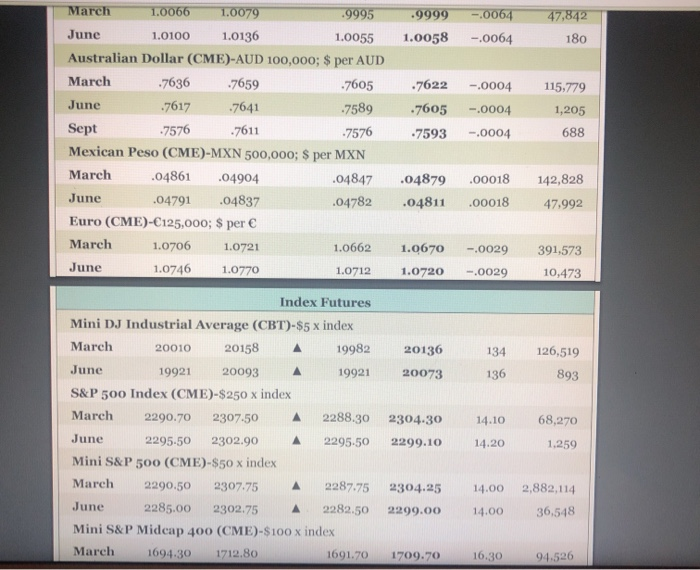
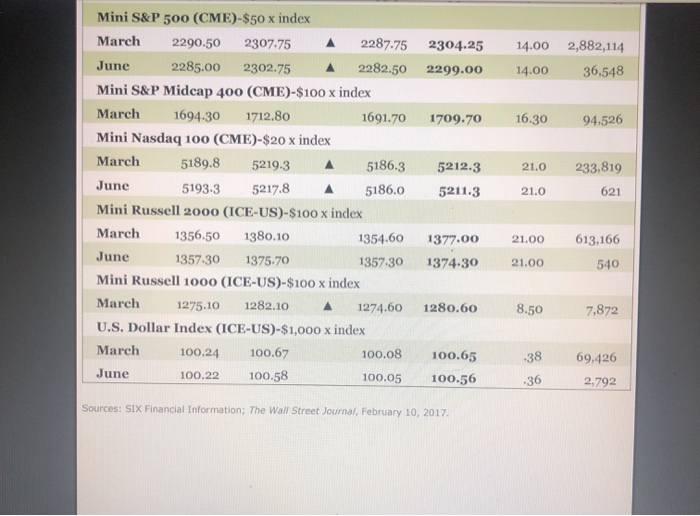
Suppose you sell nine March 2017 silver futures contracts on this day, at the last price of the day. Use Table 23.1 a. What will your profit or loss be if silver prices turn out to be $17.87 per ounce at expiration? (Do not round intermediate calculations. Enter your answer as a positive value rounded to the nearest whole number, e.g., 32.) b.What will your profit or loss be if silver prices are $17.66 per ounce at expiration? (Do not round intermediate calculations. Enter your answer as a positive value rounded to the nearest whole number, e.g., 32.) a. b. Metal& Petroleum Futures Contract Open interest Open High hi lo Low Settle Chg Copper-High (CMX) -25,000 lbs; $ per lb. Feb 2.6735 2.6735 2.6715 2.6480 -0.0125 672 March 2.6660 2.6765 2.6410 2.6535 -0.0130 120,434 Gold (CMX)-100 troy oz; $ per troy oz. Feb 1239.40 1243.50 1226.90 1235.10 -2.50 1,387 April 1242.70 1246.20 1226.10 1236.80 288,888 -2.70 June 1246.10 1249.00 1230.00 1240.00 63,531 2.70 Aug 1250.10 1252.00 1235.10 -2.80 1243.10 18,296 Dec 1254.00 1256.90 1239.00 1249.20 -2.70 29,516 June'18 1266.00 1266.00 1254.80 1259.00 -2.50 4.419 Palladium (NYM)-50 troy oz; $ per troy oz. Feb 732.85 732.85 732.85 772.60 2.80 1 March 770.60 778.80 768.00 772.55 2.80 22,948 June 780.00 771.00 770.40 774.00 2.85 6,503 Sept 775-30 777.00 775.10 775.00 3.60 17 Platinum (NYM) -50 troy oz; $ per troy oz Feb 978.80 979.10 978.80 1019.20 2.80 42 April 1019.60 1032.10 1016.20 1022.20 2.80 59,479 Silver (CMX) -5,000 troy oz.; $ per troy oz Feb 17.750 17.815 17.750 17.720 O.037 179 March 17.845 17.780 17.615 o.036 17.741 113,427 Crude Oil, Light Sweet (NYM)-1,000 bbls; $ per bl. March 53.00 o.66 385,634 52.37 53.21 52.37 April 52.98 53-46 280,780 53-70 52.95 0.55 May 53-42 54.10 53.88 53-41 O.51 192,554 June 53.90 264,679 54.45 53-90 54.25 O.49 229,809 Dec 54.79 55-35 54-79 55.21 O.49 Dec'18 55.10 55-50 55-32 0.37 55.04 111,505 NY Harbor ULSD (NYM)-42,000 gal; $ per gal. March 1.6360 1.6624 1.6345 1.6415 0055 111,133 April 1.6443 1.6693 1.6435 1.6500 0059 72,273 Gasoline-NY RBOB (NYM)-42,000 gal; $ per gal. March 1.5811 1.5510 1.5471 1.5702 .0175 112,099 April 1.7600 1.7800 1.7575 1.7741 85.512 .0122 Natural Gas (NYM)-10,000 MMBtu; $ per MMBtu. March 3.189 3.143 3.110 3.141 .015 197,215 April 3.253 3.212 3.179 146,224 3.209 .013 ay 3.269 3.311 3.240 3.272 .017 137,143 June 3.365 3.339 3.298 79.485 3-330 .019 July 3-385 3.413 3-380 3.350 020 79,570 Oct 3.385 3-358 3.423 3-392 93,442 .020 Agriculture Futures Corn (CBT)-5,000 bu; cents per bu. Corn (CBT)-5,000 bu; cents per bu March 367.50 369.50 369.50 372.75 -1.25 500,405 380.25 ay 346,739 377.25 375.25 377.25 -1.25 Oats (CBT)-5,00o bu; cents per bu. March 256.00 257-50 250.00 254-50 .50 4,155 248.25 May 246.00 254.00 253.00 3.00 3,027 Soybeans (CBT)-5,000 bu; cents per bu. March 1061.50 -8.25 248,998 1057.00 1045.00 1050.50 May 1067.25 210,368 1071.50 1061.50 1055-50 -7-75 Soybean Meal (CBT)-100 tons; $ per ton. March 341.60 340.70 338.40 -2.80 126,399 335.90 May 344.80 345.80 342.60 122,484 340.10 -2.70 Soybean Oil (CBT)-60,000 lbs; cents per lb March 34.67 34.98 34.67 34.47 .02 123,991 ay 34.96 35.26 34-76 118,319 34.95 -03 Rough Rice (CBT)-2,000 cwt; $ per ewt. March 953.00 960.50 942.00 -8.00 947-50 9.388 ay 978.50 984.50 968.00 -8.50 972.50 2,516 Wheat (CBT)-5,000 bu.; cents per bu arch 430.50 444.00 429.50 443-50 179,982 11.00 ay 442.00 455-50 440.75 455.25 11.75 137,497 Wheat (KC)-5,000 bu; cents per bu. March 440.25 438.25 451.75 451.25 9.25 71,740 July 465.25 462.75 475.25 8.50 475.00 69,377 Wheat (MPLS)-5,000 bu; cents per bu. March 569.50 557-50 556.00 568.50 11.00 24,788 May 556.75 567.00 566.50 555-50 9.25 29,537 Cattle-Feeder (CME)-50,000 lbs.; cents per lb. March 122.525 123.800 121.900 123.625 1.325 19,575 April 123.250 124.200 122.450 124.050 1.075 10,511 Cattle-Live (CME) -40,000 lbs; cents per Ib. Feb 117.250 117.750 116.775 117.650 875 17,410 April 115.000 115.175 114.825 114.125 .075 144,593 Hogs-Lean (CME)-40,000 lbs; cents per lb. Feb 73.900 74-500 73-550 875 74.225 14,671 April 72.125 72.250 70.625 70.775 104,603 950 Lumber (CME) - 1 10.000 bd. ft., $ per 1,000 bd. ft. March 381.70 381.70 373.80 375-40 2,698 3-50 y 379.60 381.70 A 378.40 375.90 2.60 1,541 Milk (CME)-200,000 lbs.; cents per lb. Feb 16.87 16.89 16.79 16.85 4,180 March 16.91 17.03 16.73 16.97 .03 4.392 Cocoa (ICE-US) -10 metric tons; $ per ton. March 1,993 2,018 1,969 1,974 -19 35.455 ay 2,008 2,038 1,988 1,996 -15 105,293 Coffee (ICE-US)-37.500 lbs; cents per lb. March 143.40 145-70 145.20 142.85 43.558 2.30 May 148.05 145-95 145.25 147.60 2.30 73,254 Sugar-World (1CE-US)-112,000 lbs; cents per lb. March 21.03 20.62 20.65 20.74 220,619 -.11 ay 20.72 20.97 20.61 20.65 -.08 224,526 Sugar-Domestic (ICE-US)-112,000 lbs; cents per Ib ay 30.40 30.40 30.40 946 30.32 .07 July 30.40 1,768 30.40 30.39 30.40 Cotton (ICE-US)-50,000 lbs; cents per lb. March 75-43 76.13 75.58 75.25 104,332 33 ay 76.40 76.40 76.65 77.30 97.772 22 Orange Juice (ICE-US)-15,000 lbs; cents per lb. March 172.65 175.00 7.438 171.55 174.00 1.00 ay 167.80 169.75 166.80 168.75 .60 3.434 Interest Rate Futures Treasury Bonds (CBT)-$100,000; pts 32nds of 100% March 153-160 153-170 151-310 152-060 622,929 -1-030 June 152-060 152-060 150-240 150-300 -1-030 2,310 Treasury Notes (CBT)-$100,000; pts 32nds of 100% March 125-155 125-155 124-270 124-295 3,169,794 -14.0 June 124-265 124-270 124-105 -14.5 68,648 124-120 5 Yr. Treasury Notes (CBT)-$100,000; pts 32nds of 100% March 118-132 118-132 118-012 118-025 -8.5 3,119,541 June 118-015 118-015 117-230 117-235 -9.0 137,090 2 Yr. Treasury Notes (CBT)-$200,000; pts 32nds of 100% rch 108-170 108-172 108-142 108-147 -2.0 1,349,070 June 108-060 108-060 108-060 108-055 8,979 -2.5 30 Day Federal Funds (CBT)-$5,000,000; 100-daily avg. Feb 99-343 99.345 99.343 99.342 -.001 100,104 April 99.315 99.320 99.305 99.310 -005 373,852 10 Yr. Del. Int. Rate Swaps (CBT)-$100,000; pts 32nds of 100% March 94.703 94-766 94.359 94-438 438 31,717 1 Month Llbor (CME)-$3,000,000; pts of 100 % Feb 99.2275 4,896 Eurodollar (CME)-$1,000,000; pts of 100% Feb 98.9650 98.9650 98.9625 98.9625 -.0025 83,716 March 98.9450 98.9450 98.9300 98.9350 -0100 1,455,611 June 98.8000 98.8000 98.7750 98.78o0 -.0200 1,434,355 Dec 98.5450 98.5400 98.5000 98.5050 .0300 1,350,776 Currency Futures Japanese Yen (CME)- Y12,500,000; $ per 100Y March 8948 8949 .8829 .8834 -.0097 191,960 June .8982 .8986 8868 .8872 -0096 9,846 Canadian Dollar (CME)-CAD 100.000; $ per CAD March 7610 7639 7596 7614 .0011 115.305 June 7619 -7646 7604 7622 2,625 .0011 British Pound (CME)-62,500; $ per March 1.2544 1.2589 1.2497 1.2502 208,495 -.0031 June 1.2563 1.2616 1.2527 1.2531 -.0032 1,661 Swiss Franc (CME)-CHF 125,000; $ per CHF March 1,0066 1.0079 9995 9999 47.842 .0064 June 1.0136 1.0100 1.0058 1.0055 -0064 180 Australian Dollar (CME)-AUD 100,000; $ per AUD March 7636 7659 -7605 -7622 -0004 115,779 June .7617 7641 .7589 7605 0004 1,205 Sept 7576 7611 7576 688 7593 0004 Mexican Peso (CME)-MXN 500,000; $ per MXN March 04861 .04904 04847 .00018 04879 142,828 June .04791 .04837 .04782 .04811 00018 47,992 Euro (CME)-C125,000; $ per March 1.0706 1.0721 1.0662 1.0670 -0029 391,573 June 1.0746 1.0770 1.0712 1.0720 10,473 -.0029 Index Futures Mini DJ Industrial Average (CBT)-$5 x index March 20158 20010 19982 20136 126,519 134 June 19921 20093 20073 19921 136 893 S&P 500 Index (CME)-$250 x index March 2288.30 2290.70 2307-50 68,270 2304.30 14.10 June 2295-50 2302.90 2295-50 2299.10 14.20 1,259 Mini S&P 500 (CME)-$50 x index March 2287-75 2290.50 2307.75 A 2304.25 2,882,114 14.00 June 2285.00 2282.50 2302.75 2299.00 14.00 36,548 Mini S&P Midcap 400 (CME)-$100 x index March 1694.30 1712.80 1691.70 16.30 1709.70 94.526 Mini S&P 500 (CME)-$50 x index March 2287.75 2290.50 2307.75 14.00 2,882,114 2304.25 2285.00 2302.75 June 2282.50 2299.00 36,548 14.00 Mini S&P Midcap 400 (CME)-$100 x index March 1694.30 1712.80 1691.70 16.30 1709.70 94.526 Mini Nasdaq 100 (CME)-$20 x index March 5189.8 5186.3 5219.3 233,819 5212.3 21.0 June 5193-3 5217.8 5186.0 5211.3 621 21.0 Mini Russell 2000 (ICE-US)-$100 x index March 1356.50 1380.10 1354.60 613,166 1377.00 21.00 June 1357-30 1375-70 1357-30 1374-30 21.00 540 Mini Russell 1o00 (ICE-US)-$100 x index March 1282.10 1275.10 1280.60 1274.60 8.50 7,872 U.S. Dollar Index (ICE-US)-$1,000 x index March 100.67 100.24 100.08 100.65 69,426 -38 June 100.22 100.58 100.05 100.56 -36 2.792 Sources: SIX Financial Information; The Wall Street Journal, February 10, 2017