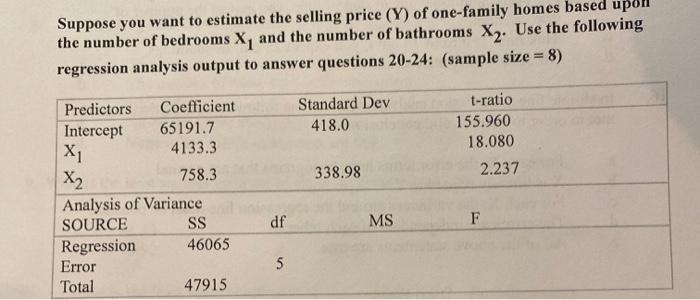
Suppose you want to estimate the selling price (Y) of one-family homes based up the number of bedrooms X, and the number of bathrooms X2. Use the following regression analysis output to answer questions 20-24: (sample size = 8) Standard Dev 418.0 t-ratio 155.960 18.080 2.237 338.98 Predictors Coefficient Intercept 65191.7 X1 4133.3 X2 758.3 Analysis of Variance SOURCE SS Regression 46065 Error Total 47915 df MS F 5 23. What is the Adjusted ? ? 0.8924 a. b. 0.9614 0.8746 C. d. 0.9460 0.7839 24 . What is the standard error (S.)? (to 2 decimals) c. none of the above a. b. 17.33 19.24 d. 18.25 21.92 25. Two sports analysts are debating on which is a better predictor of MLB team's winning percentage (WIN). One believes that a team's batting average (BA) is better, while the other analyst believes that a team's pitching as measured by the team's earned run average (ERA) is better. The data is collected for all MLB teams in 2018 and they build a linear regression model to predict the variable WIN. Using the partial printouts below, which model appears to be best for prediction: Model 1: BA Model 2: ERA R-Square Adj R-Square Standard Error 0.2112 0.1830 0.0614 0.4656 0.4465 0.0505 Model 3: BA and ERA 0.7156 0.6945 0.0375 a. b. c. Model 1 with one predictor, Team Batting Average (BA) Model 2 with one predictor, Team Earned Run Average (ERA) Model 3 with both predictors, Team Batting Average (BA) and Earned Run Average (ERA) any of these will do none of these will do d. e. Suppose you want to estimate the selling price (Y) of one-family homes based up the number of bedrooms X, and the number of bathrooms X2. Use the following regression analysis output to answer questions 20-24: (sample size = 8) Standard Dev 418.0 t-ratio 155.960 18.080 2.237 338.98 Predictors Coefficient Intercept 65191.7 X1 4133.3 X2 758.3 Analysis of Variance SOURCE SS Regression 46065 Error Total 47915 df MS F 5 23. What is the Adjusted ? ? 0.8924 a. b. 0.9614 0.8746 C. d. 0.9460 0.7839 24 . What is the standard error (S.)? (to 2 decimals) c. none of the above a. b. 17.33 19.24 d. 18.25 21.92 25. Two sports analysts are debating on which is a better predictor of MLB team's winning percentage (WIN). One believes that a team's batting average (BA) is better, while the other analyst believes that a team's pitching as measured by the team's earned run average (ERA) is better. The data is collected for all MLB teams in 2018 and they build a linear regression model to predict the variable WIN. Using the partial printouts below, which model appears to be best for prediction: Model 1: BA Model 2: ERA R-Square Adj R-Square Standard Error 0.2112 0.1830 0.0614 0.4656 0.4465 0.0505 Model 3: BA and ERA 0.7156 0.6945 0.0375 a. b. c. Model 1 with one predictor, Team Batting Average (BA) Model 2 with one predictor, Team Earned Run Average (ERA) Model 3 with both predictors, Team Batting Average (BA) and Earned Run Average (ERA) any of these will do none of these will do d. e