

Answered step by step
Verified Expert Solution
Question
1 Approved Answer
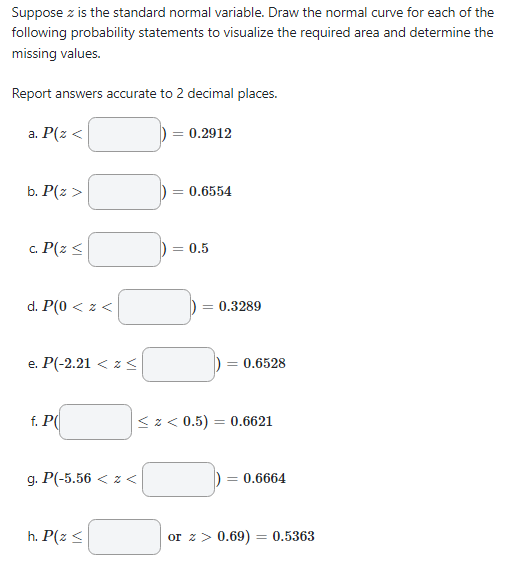
Suppose z is the standard normal variable. Draw the normal curve for each of the following probability statements to visualize the required area and determine
Step by Step Solution
There are 3 Steps involved in it
Step: 1

Get Instant Access to Expert-Tailored Solutions
See step-by-step solutions with expert insights and AI powered tools for academic success
Step: 2

Step: 3
Ace Your Homework with AI
Get the answers you need in no time with our AI-driven, step-by-step assistance
Get Started
The Equation Of Knowledge From Bayes Rule To A Unified Philosophy Of Science
Authors: Lê Nguyên Hoang
1st Edition
1000063275, 9781000063271