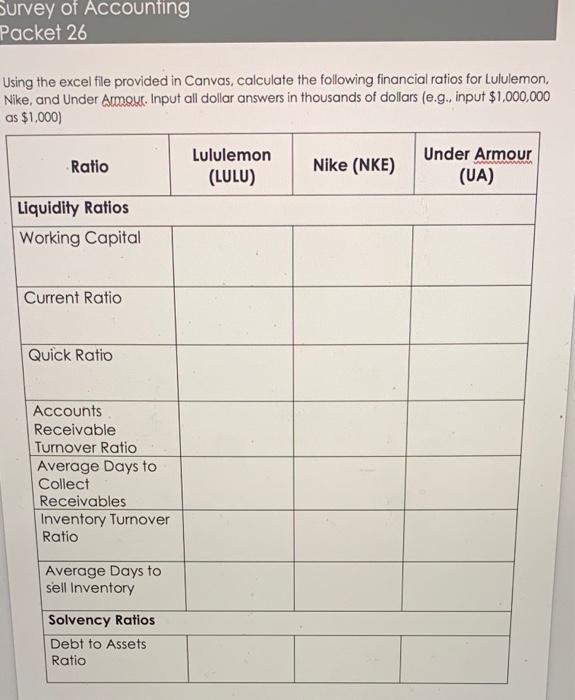
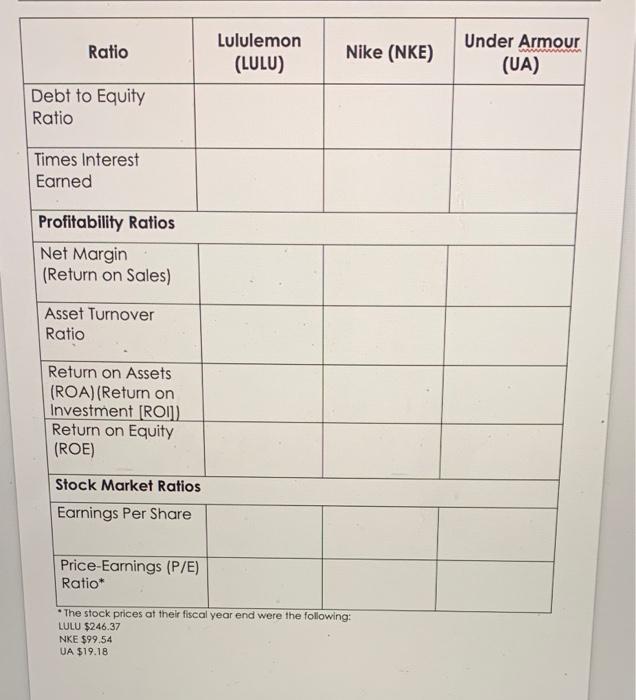
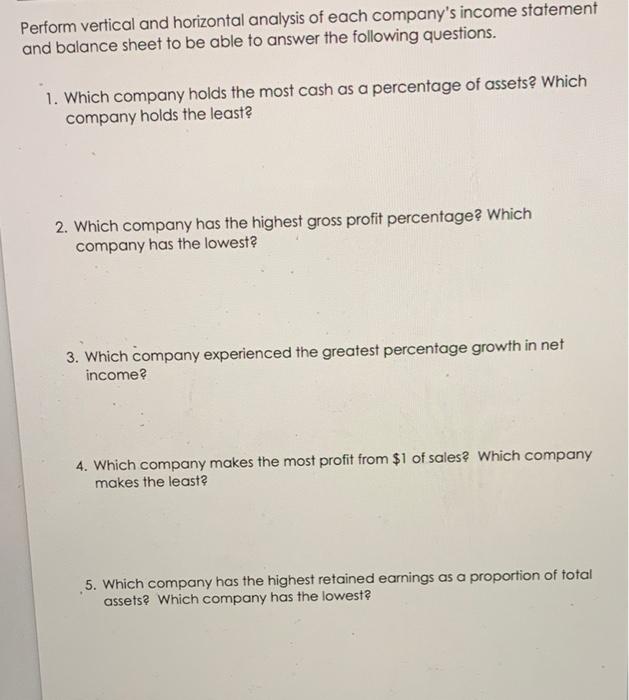
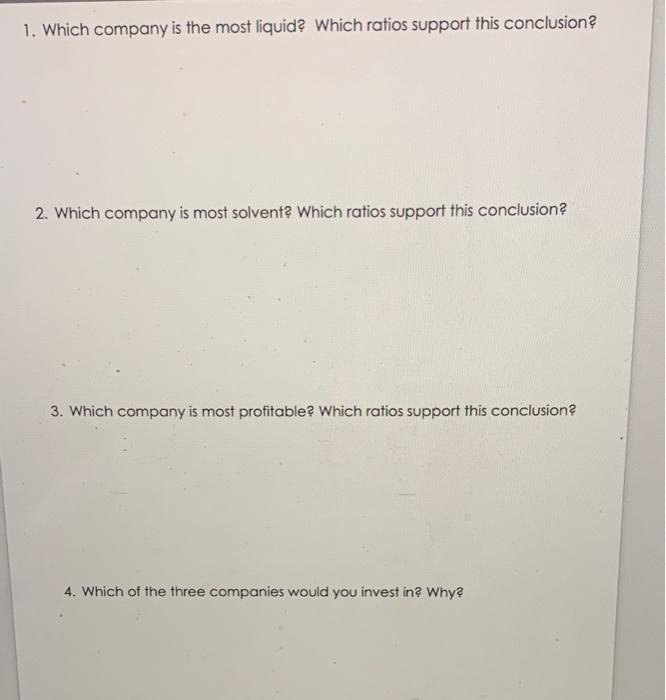
Survey of Accounting Packet 26 Using the excel file provided in Canvas, calculate the following financial ratios for Lululemon, Nike, and Under Armour. Input all dollar answers in thousands of dollars (e.g. input $1,000,000 as $1.000) Ratio Lululemon (LULU) Nike (NKE) Under Armour (UA) Liquidity Ratios Working Capital Current Ratio Quick Ratio Accounts Receivable Turnover Ratio Average Days to Collect Receivables Inventory Turnover Ratio Average Days to sell Inventory Solvency Ratios Debt to Assets Ratio Ratio Lululemon (LULU) Nike (NKE) Under Armour (UA) Debt to Equity Ratio Times Interest Earned Profitability Ratios Net Margin (Return on Sales) Asset Turnover Ratio Return on Assets (ROA) (Return on Investment (ROI]) Return on Equity (ROE) Stock Market Ratios Earnings Per Share Price-Earnings (P/E) Ratio* * The stock prices at their fiscal year end were the following: LULU $246.37 NKE $99.54 UA $19.18 Perform vertical and horizontal analysis of each company's income statement and balance sheet to be able to answer the following questions. 1. Which company holds the most cash as a percentage of assets? Which company holds the least? 2. Which company has the highest gross profit percentage? Which company has the lowest? 3. Which company experienced the greatest percentage growth in net income? 4. Which company makes the most profit from $1 of sales? Which company makes the least? 5. Which company has the highest retained earnings as a proportion of total assets? Which company has the lowest 1. Which company is the most liquid? Which ratios support this conclusion? 2. Which company is most solvent? Which ratios support this conclusion? 3. Which company is most profitable? Which ratios support this conclusion 4. Which of the three companies would you invest in? Why? Survey of Accounting Packet 26 Using the excel file provided in Canvas, calculate the following financial ratios for Lululemon, Nike, and Under Armour. Input all dollar answers in thousands of dollars (e.g. input $1,000,000 as $1.000) Ratio Lululemon (LULU) Nike (NKE) Under Armour (UA) Liquidity Ratios Working Capital Current Ratio Quick Ratio Accounts Receivable Turnover Ratio Average Days to Collect Receivables Inventory Turnover Ratio Average Days to sell Inventory Solvency Ratios Debt to Assets Ratio Ratio Lululemon (LULU) Nike (NKE) Under Armour (UA) Debt to Equity Ratio Times Interest Earned Profitability Ratios Net Margin (Return on Sales) Asset Turnover Ratio Return on Assets (ROA) (Return on Investment (ROI]) Return on Equity (ROE) Stock Market Ratios Earnings Per Share Price-Earnings (P/E) Ratio* * The stock prices at their fiscal year end were the following: LULU $246.37 NKE $99.54 UA $19.18 Perform vertical and horizontal analysis of each company's income statement and balance sheet to be able to answer the following questions. 1. Which company holds the most cash as a percentage of assets? Which company holds the least? 2. Which company has the highest gross profit percentage? Which company has the lowest? 3. Which company experienced the greatest percentage growth in net income? 4. Which company makes the most profit from $1 of sales? Which company makes the least? 5. Which company has the highest retained earnings as a proportion of total assets? Which company has the lowest 1. Which company is the most liquid? Which ratios support this conclusion? 2. Which company is most solvent? Which ratios support this conclusion? 3. Which company is most profitable? Which ratios support this conclusion 4. Which of the three companies would you invest in? Why


