Answered step by step
Verified Expert Solution
Link Copied!

Question

1 Approved Answer

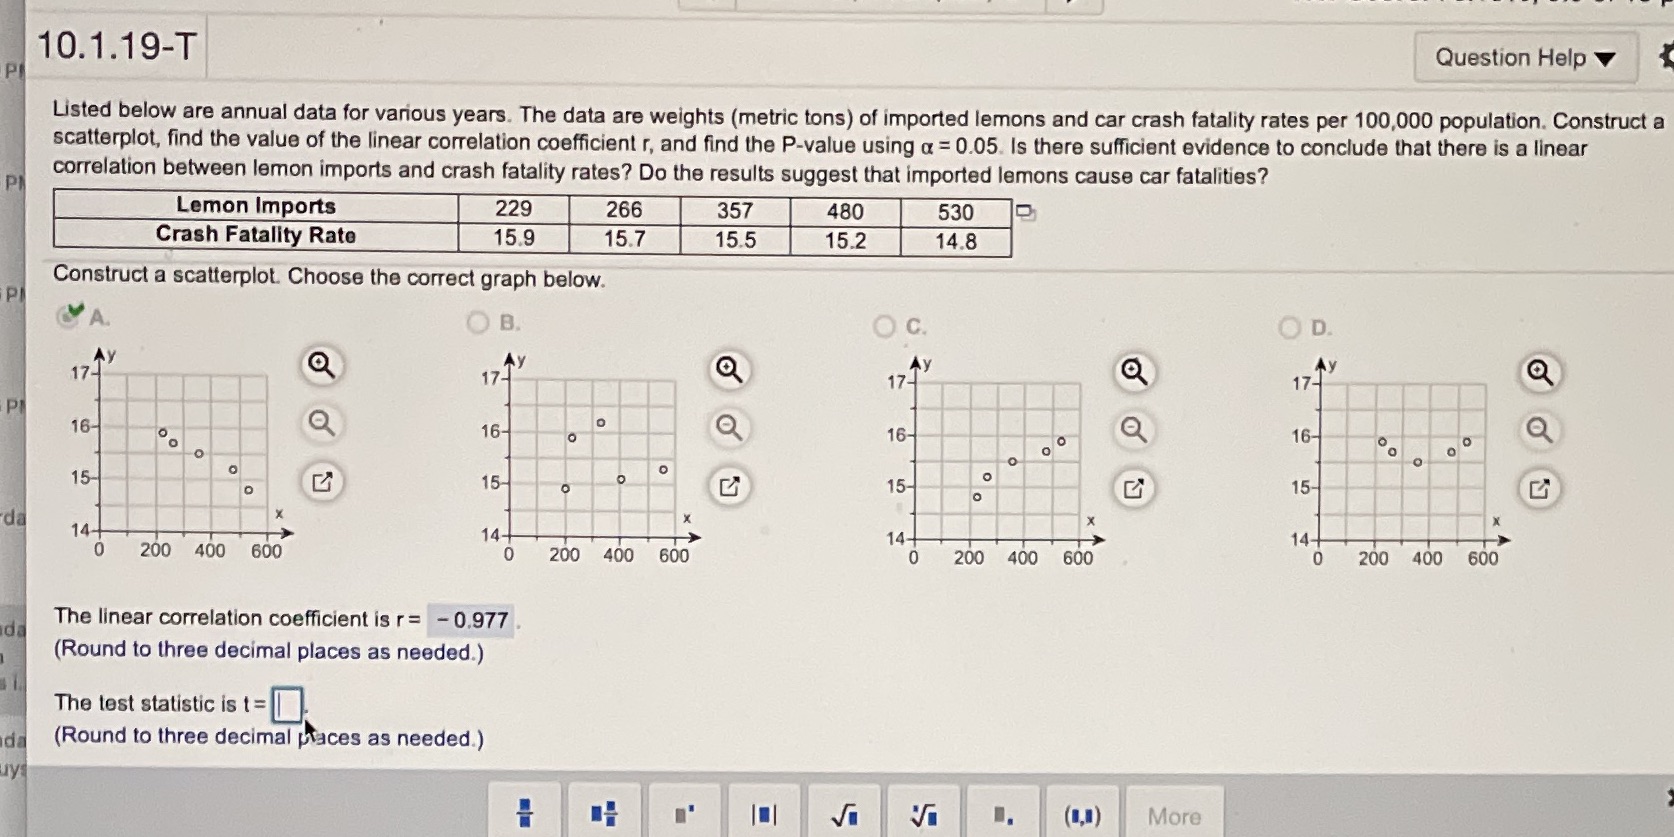
T=? 10.1.19-T Question Help Listed below are annual data for various years. The data are weights (metric tons) of imported lemons and car crash fatality

T=?

image text in transcribed
10.1.19-T Question Help Listed below are annual data for various years. The data are weights (metric tons) of imported lemons and car crash fatality rates per 100,000 population. Construct a scatterplot, find the value of the linear correlation coefficient r, and find the P-value using a = 0.05. Is there sufficient evidence to conclude that there is a linear PI correlation between lemon imports and crash fatality rates? Do the results suggest that imported lemons cause car fatalities? Lemon Imports 229 266 357 480 530 Crash Fatality Rate 15.9 15.7 15.5 15.2 14.8 PI Construct a scatterplot. Choose the correct graph below. OB. O C. OD. 17- 12 My 17 My 16- 16- O O O 16- O 16- o o 15- O 15- 15- O 15- da X 14+ X 0 200 400 600 14+ 200 400 600 14+ 0 200 400 600 14+ 0 200 400 600 da The linear correlation coefficient is r= - 0.977. (Round to three decimal places as needed.) The test statistic is t = da (Round to three decimal places as needed.) uys 101 Vi Vi I. (1,!) More

Step by Step Solution

There are 3 Steps involved in it

Step: 1

blur-text-image

Get Instant Access with AI-Powered Solutions

See step-by-step solutions with expert insights and AI powered tools for academic success

Step: 2

blur-text-image

Step: 3

blur-text-image

Ace Your Homework with AI

Get the answers you need in no time with our AI-driven, step-by-step assistance

Get Started

Recommended Textbook for

Income Tax Fundamentals 2013

Authors: Gerald E. Whittenburg, Martha Altus Buller, Steven L Gill

31st Edition

1111972516, 978-1285586618, 1285586611, 978-1285613109, 978-1111972516

Students also viewed these Mathematics questions