

Answered step by step
Verified Expert Solution
Question
1 Approved Answer
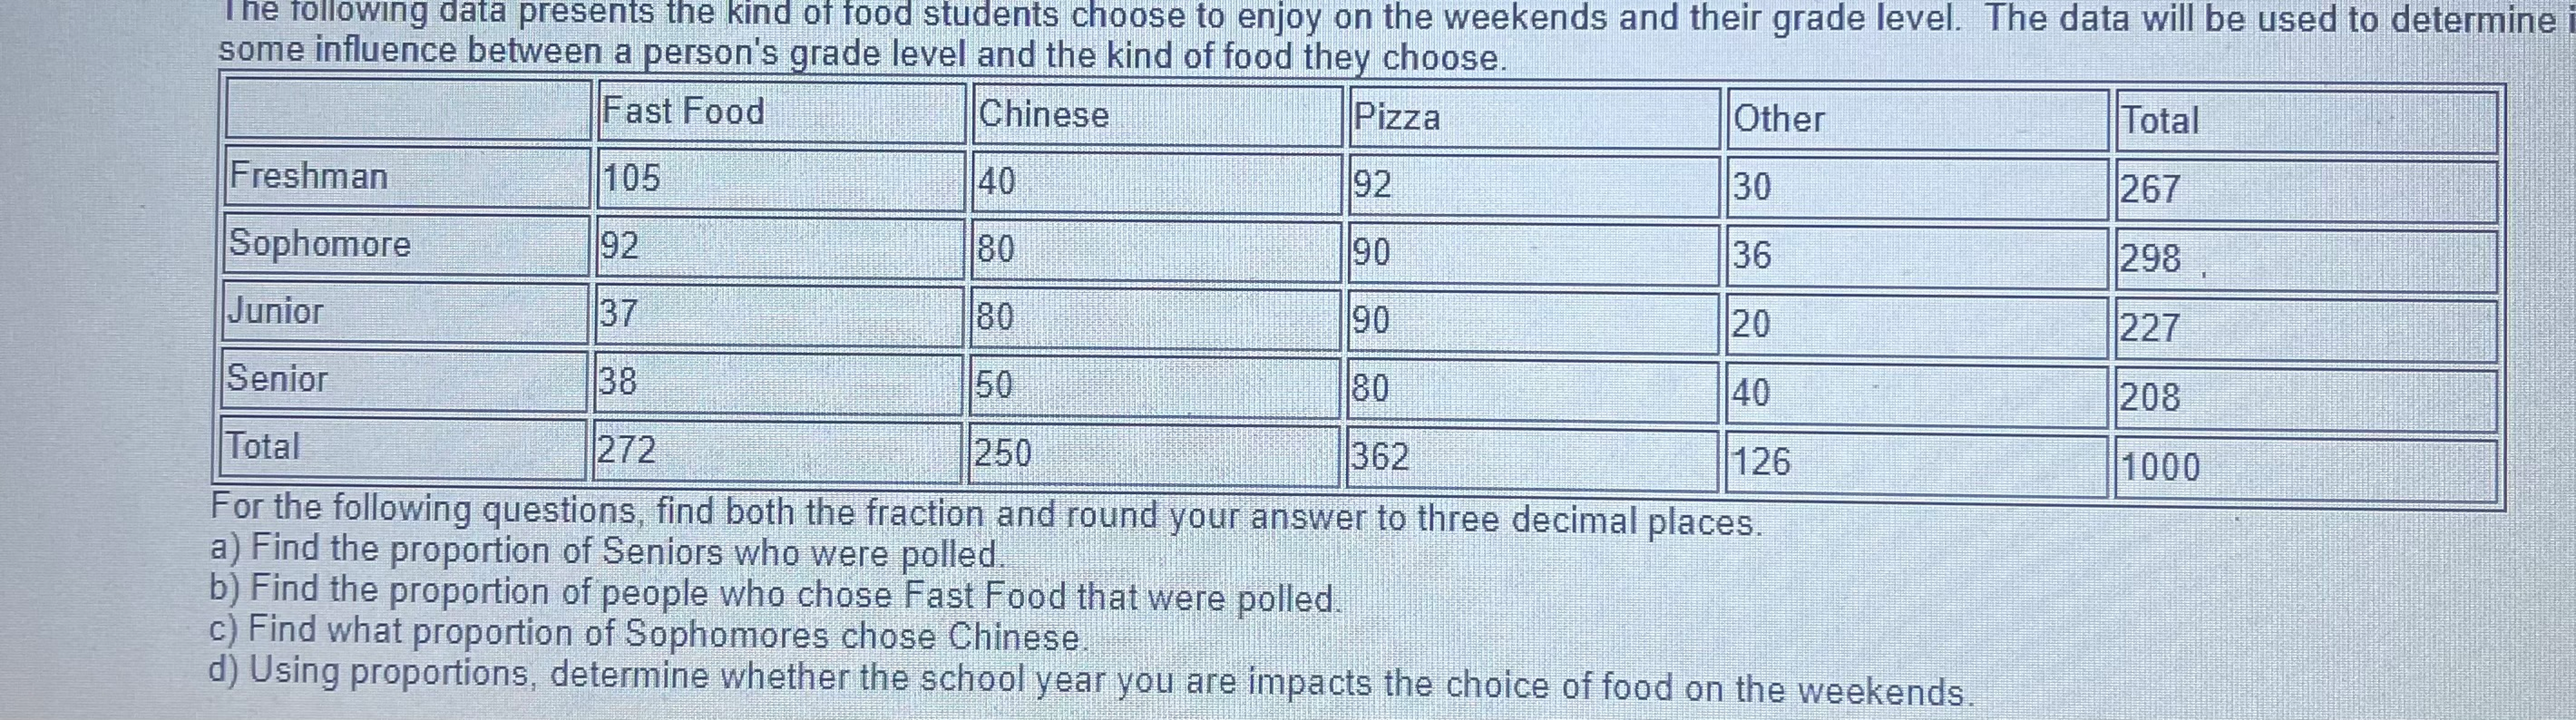
T he following data presents the kind of food students choose to enjoy on the weekends and their grade level. The data will be used

Step by Step Solution
There are 3 Steps involved in it
Step: 1

Get Instant Access to Expert-Tailored Solutions
See step-by-step solutions with expert insights and AI powered tools for academic success
Step: 2

Step: 3
Ace Your Homework with AI
Get the answers you need in no time with our AI-driven, step-by-step assistance
Get Started
Calculus Single And Multivariable
Authors: Deborah Hughes Hallett, Andrew M Gleason, William G McCallum
8th Edition
1119783267, 9781119783268