

Question: Table 1. Cooling data of thermometer Time 0 5 Thermometer Surrounding Temp (C) Temp (C) 80 25 80 25 25 55 25 53 25 51
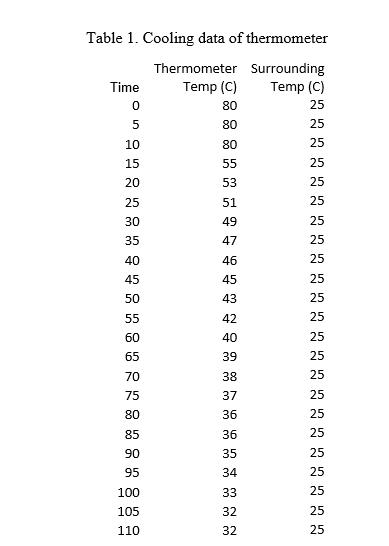
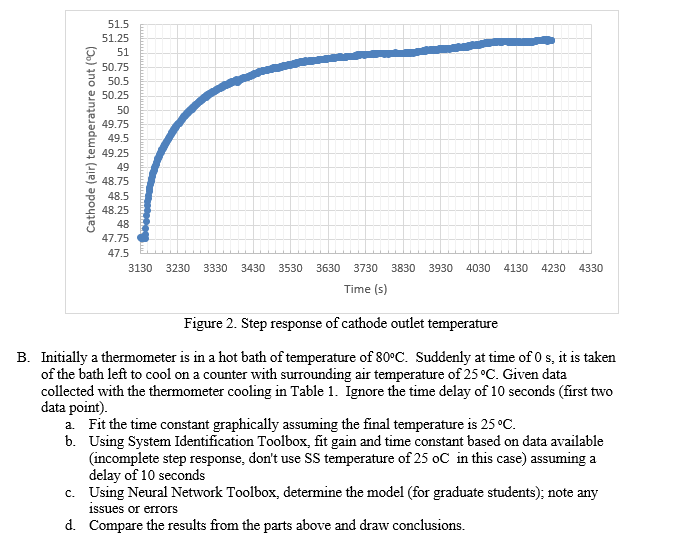
Table 1. Cooling data of thermometer Time 0 5 Thermometer Surrounding Temp (C) Temp (C) 80 25 80 25 25 55 25 53 25 51 25 80 10 15 20 25 30 49 25 35 47 25 40 46 25 45 45 43 25 25 42 25 40 25 50 55 60 65 70 75 39 25 25 38 37 25 25 80 36 85 36 25 35 90 95 25 25 34 33 25 100 105 32 25 110 32 25 Cathode (air) temperature out (C) 51.5 51.25 g 51 50.75 50.5 50.25 50 49.75 49.5 49.25 49 48.75 48.5 48.25 48 47.75 47.5 3130 3230 3330 3430 3530 3630 3730 3830 3930 4030 4130 4230 4330 Time (s) Figure 2. Step response of cathode outlet temperature B. Initially a thermometer is in a hot bath of temperature of 80C. Suddenly at time of 0 s, it is taken of the bath left to cool on a counter with surrounding air temperature of 25 C. Given data collected with the thermometer cooling in Table 1. Ignore the time delay of 10 seconds (first two data point) a. Fit the time constant graphically assuming the final temperature is 25C. b. Using System Identification Toolbox, fit gain and time constant based on data available (incomplete step response, don't use SS temperature of 25 oC in this case) assuming a delay of 10 seconds c. Using Neural Network Toolbox, determine the model (for graduate students); note any issues or errors d. Compare the results from the parts above and draw conclusions. Table 1. Cooling data of thermometer Time 0 5 Thermometer Surrounding Temp (C) Temp (C) 80 25 80 25 25 55 25 53 25 51 25 80 10 15 20 25 30 49 25 35 47 25 40 46 25 45 45 43 25 25 42 25 40 25 50 55 60 65 70 75 39 25 25 38 37 25 25 80 36 85 36 25 35 90 95 25 25 34 33 25 100 105 32 25 110 32 25 Cathode (air) temperature out (C) 51.5 51.25 g 51 50.75 50.5 50.25 50 49.75 49.5 49.25 49 48.75 48.5 48.25 48 47.75 47.5 3130 3230 3330 3430 3530 3630 3730 3830 3930 4030 4130 4230 4330 Time (s) Figure 2. Step response of cathode outlet temperature B. Initially a thermometer is in a hot bath of temperature of 80C. Suddenly at time of 0 s, it is taken of the bath left to cool on a counter with surrounding air temperature of 25 C. Given data collected with the thermometer cooling in Table 1. Ignore the time delay of 10 seconds (first two data point) a. Fit the time constant graphically assuming the final temperature is 25C. b. Using System Identification Toolbox, fit gain and time constant based on data available (incomplete step response, don't use SS temperature of 25 oC in this case) assuming a delay of 10 seconds c. Using Neural Network Toolbox, determine the model (for graduate students); note any issues or errors d. Compare the results from the parts above and draw conclusions
Step by Step Solution
There are 3 Steps involved in it

Get step-by-step solutions from verified subject matter experts