

Answered step by step
Verified Expert Solution
Question
1 Approved Answer
Table 1: Historical Demand for 12 weeks Week1 Week2 Week3 Week4 Week5 Week6 Week7 Week8 Week9 Week10 Week11 Week12 Atlanta 33 45 37 38
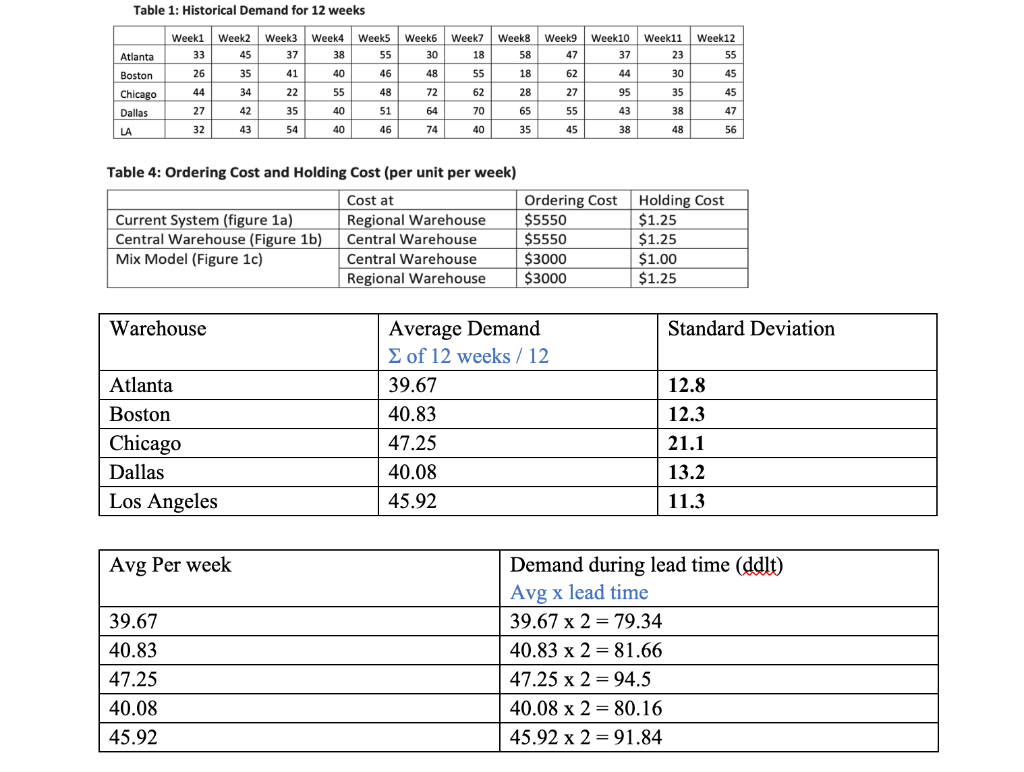
Table 1: Historical Demand for 12 weeks Week1 Week2 Week3 Week4 Week5 Week6 Week7 Week8 Week9 Week10 Week11 Week12 Atlanta 33 45 37 38 55 30 18 58 47 37 23 55 Boston 26 35 41 40 46 48 55 18 62 44 30 45 Chicago 44 34 22 55 48 72 62 28 27 95 35 45 Dallas 27 42 35 40 51 64 70 65 55 43 38 47 LA 32 43 54 40 46 74 40 35 45 38 48 56 Central Warehouse (Figure 1b) Table 4: Ordering Cost and Holding Cost (per unit per week) Current System (figure 1a) Mix Model (Figure 1c) Cost at Ordering Cost Holding Cost Regional Warehouse $5550 $1.25 Central Warehouse $5550 $1.25 Central Warehouse $3000 $1.00 Regional Warehouse $3000 $1.25 Warehouse Atlanta Average Demand Standard Deviation Boston Chicago Dallas Los Angeles Avg Per week 39.67 40.83 47.25 40.08 Demand during lead time (ddlt) Avg x lead time 39.67 x 2 79.34 40.83 x 2 81.66 = 47.25 x 2 94.5 40.08 x 2-80.16 45.92 45.92 x 2 91.84 of 12 weeks 12 39.67 12.8 40.83 12.3 47.25 21.1 40.08 13.2 45.92 11.3
Step by Step Solution
There are 3 Steps involved in it
Step: 1

Get Instant Access to Expert-Tailored Solutions
See step-by-step solutions with expert insights and AI powered tools for academic success
Step: 2

Step: 3
Ace Your Homework with AI
Get the answers you need in no time with our AI-driven, step-by-step assistance
Get Started
Financial Statement Analysis
Authors: K. R. Subramanyam, John Wild
11th edition
78110963, 978-0078110962