Answered step by step
Verified Expert Solution
Question
1 Approved Answer
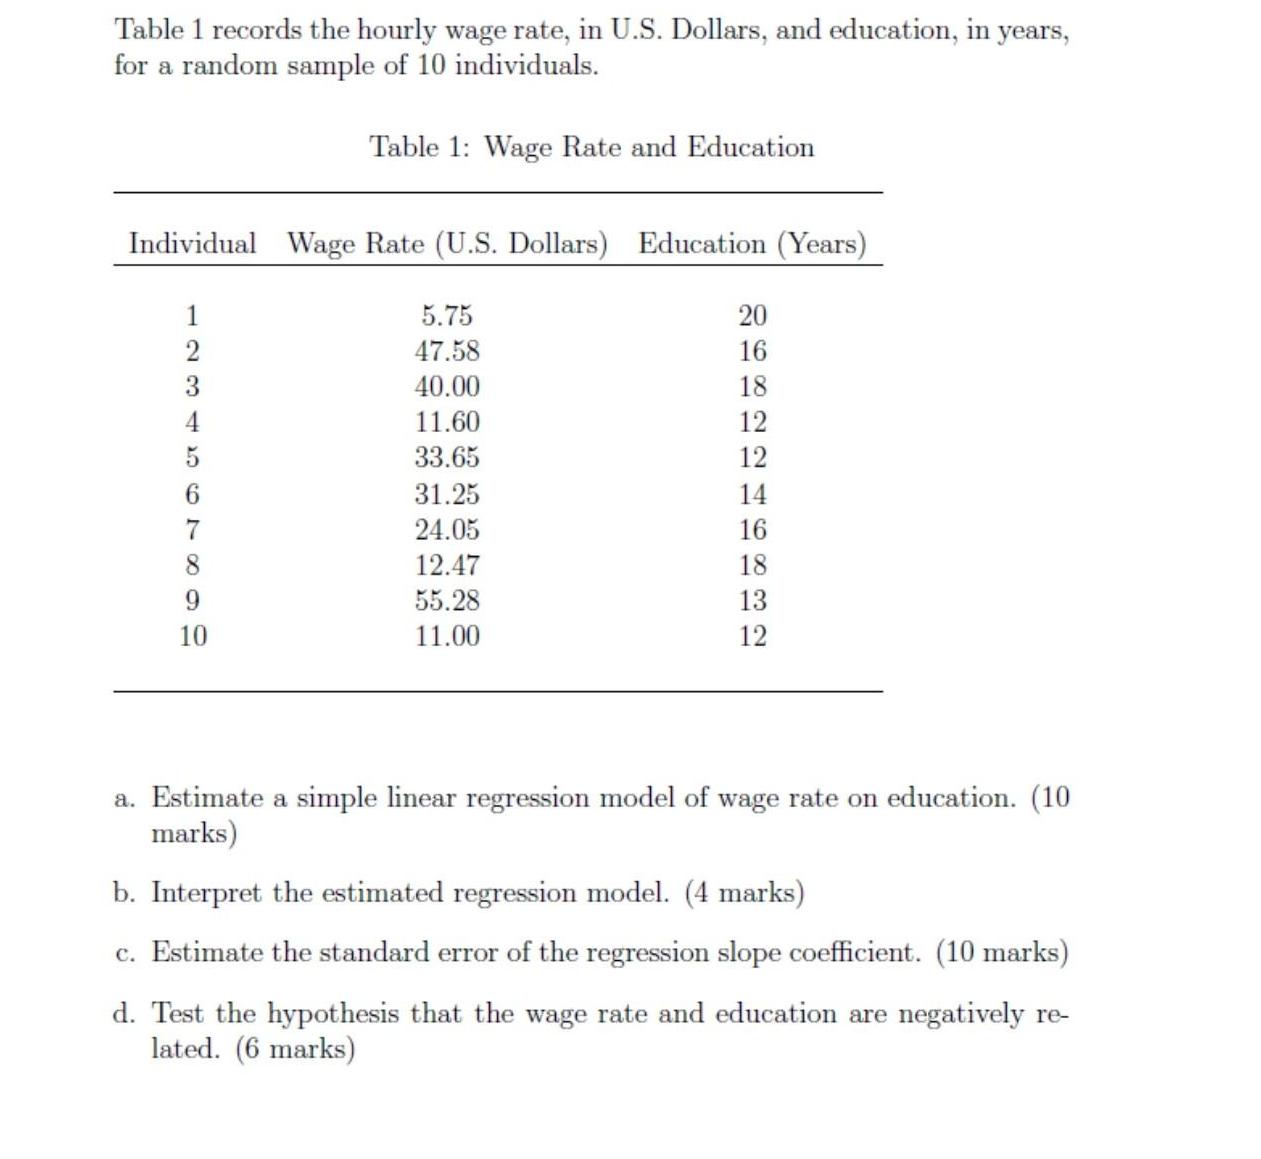
Table 1 records the hourly wage rate, in U.S. Dollars, and education, in years, for a random sample of 10 individuals. Table 1: Wage

Table 1 records the hourly wage rate, in U.S. Dollars, and education, in years, for a random sample of 10 individuals. Table 1: Wage Rate and Education Individual Wage Rate (U.S. Dollars) Education (Years) 1 2 3 4 5 7 8 9 10 5.75 47.58 40.00 11.60 33.65 31.25 24.05 12.47 55.28 11.00 20 16 18 12 12 14 16 18 13 12 a. Estimate a simple linear regression model of wage rate on education. (10 marks) b. Interpret the estimated regression model. (4 marks) c. Estimate the standard error of the regression slope coefficient. (10 marks) d. Test the hypothesis that the wage rate and education are negatively re- lated. (6 marks)
Step by Step Solution
★★★★★
3.32 Rating (149 Votes )
There are 3 Steps involved in it
Step: 1
a To estimate a simple linear regression model of wage rate on education we need to use an Excel statistical software package Assuming a linear relati...
Get Instant Access to Expert-Tailored Solutions
See step-by-step solutions with expert insights and AI powered tools for academic success
Step: 2

Step: 3

Ace Your Homework with AI
Get the answers you need in no time with our AI-driven, step-by-step assistance
Get Started


