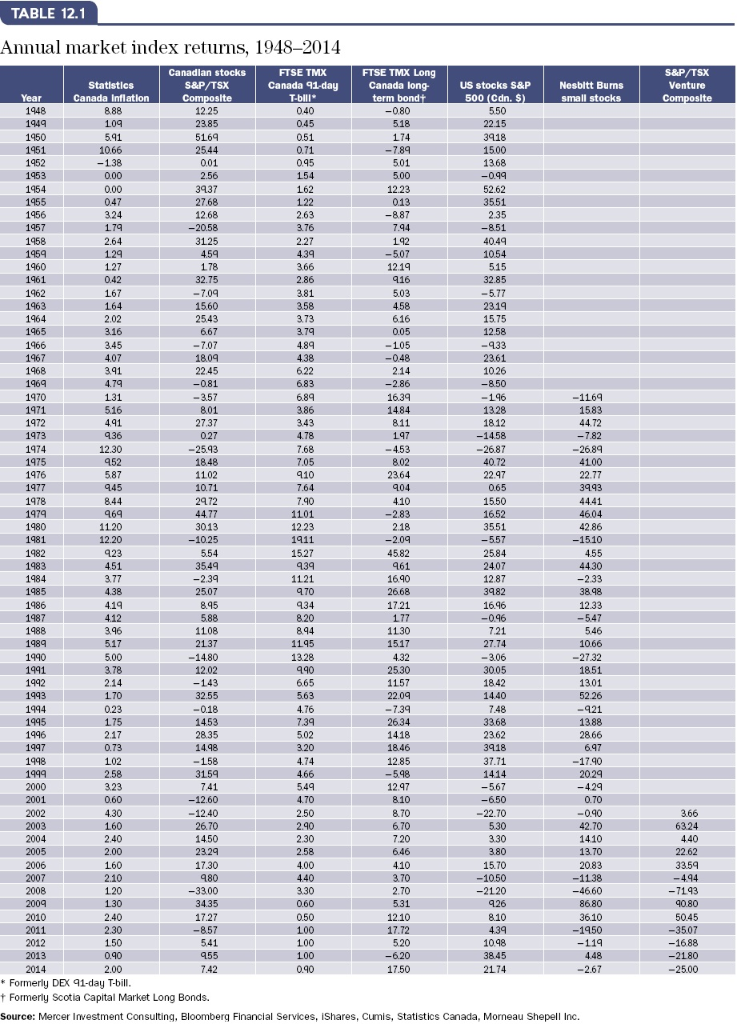
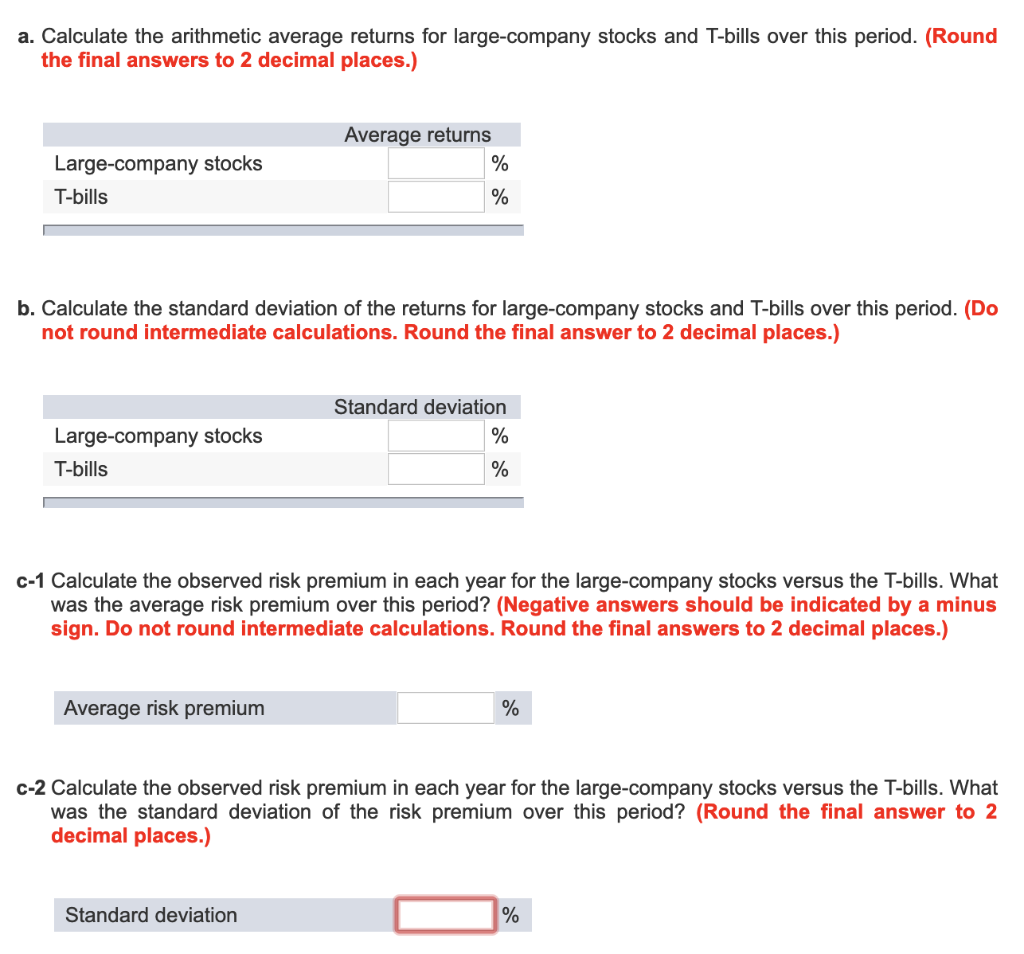
TABLE 12.1 Annual market index returns, 1948-2014 Canadlan stocks SAP/TSX FTSE TMX FTSE TMX Long S&P/TSX Statistics Canada Inflatlon Hersbltt Burms small stocks Caneda 11-day Canots long US stocks S& 789 122 3125 1959 042 3.58 2543 1583 936 1975 40.72 1979 15.27 4582 1121 3482 17.21 12.33 -0.96 2137 12.02 1851 52.26 3368 2.58 1240 26.70 -4660 8680 17.27 -3507 Formerly DEX 91-day T-bill Formerly Scotia Capital Market Long Bonds. Source: Mercer Investment Consulting, Bloomberg Financial Services, iShares, Cumis, Statistics Canada, Morneau Shepell Inc. a. Calculate the arithmetic average returns for large-company stocks and T-bills over this period. (Round the final answers to 2 decimal places.) Average returns Large-company stocks T-bills 0 0 b. Calculate the standard deviation of the returns for large-company stocks and T-bills over this period. (Do not round intermediate calculations. Round the final answer to 2 decimal places.) Standard deviation Large-company stocks T-bills 0 c-1 Calculate the observed risk premium in each year for the large-company stocks versus the T-bills. What was the average risk premium over this period? (Negative answers should be indicated by a minus sign. Do not round intermediate calculations. Round the final answers to 2 decimal places.) Average risk premium 0 c-2 Calculate the observed risk premium in each year for the large-company stocks versus the T-bills. What was the standard deviation of the risk premium over this period? (Round the final answer to 2 decimal places.) Standard deviation TABLE 12.1 Annual market index returns, 1948-2014 Canadlan stocks SAP/TSX FTSE TMX FTSE TMX Long S&P/TSX Statistics Canada Inflatlon Hersbltt Burms small stocks Caneda 11-day Canots long US stocks S& 789 122 3125 1959 042 3.58 2543 1583 936 1975 40.72 1979 15.27 4582 1121 3482 17.21 12.33 -0.96 2137 12.02 1851 52.26 3368 2.58 1240 26.70 -4660 8680 17.27 -3507 Formerly DEX 91-day T-bill Formerly Scotia Capital Market Long Bonds. Source: Mercer Investment Consulting, Bloomberg Financial Services, iShares, Cumis, Statistics Canada, Morneau Shepell Inc. a. Calculate the arithmetic average returns for large-company stocks and T-bills over this period. (Round the final answers to 2 decimal places.) Average returns Large-company stocks T-bills 0 0 b. Calculate the standard deviation of the returns for large-company stocks and T-bills over this period. (Do not round intermediate calculations. Round the final answer to 2 decimal places.) Standard deviation Large-company stocks T-bills 0 c-1 Calculate the observed risk premium in each year for the large-company stocks versus the T-bills. What was the average risk premium over this period? (Negative answers should be indicated by a minus sign. Do not round intermediate calculations. Round the final answers to 2 decimal places.) Average risk premium 0 c-2 Calculate the observed risk premium in each year for the large-company stocks versus the T-bills. What was the standard deviation of the risk premium over this period? (Round the final answer to 2 decimal places.) Standard deviation