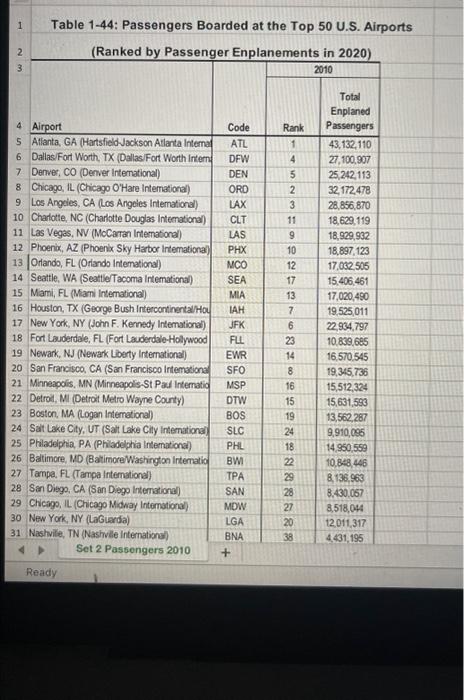
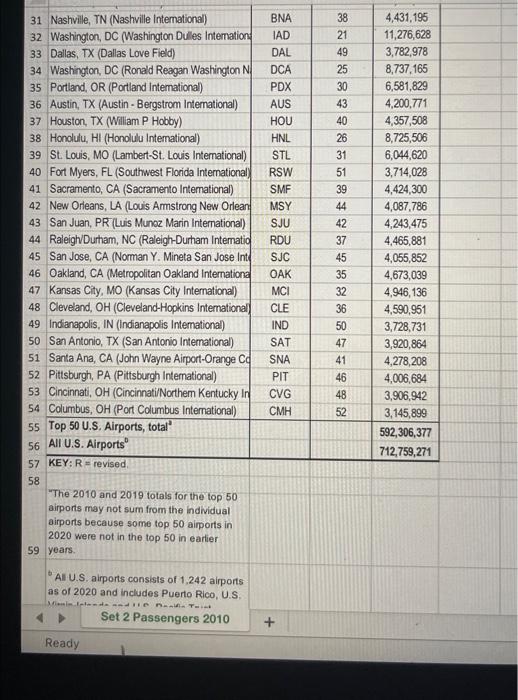
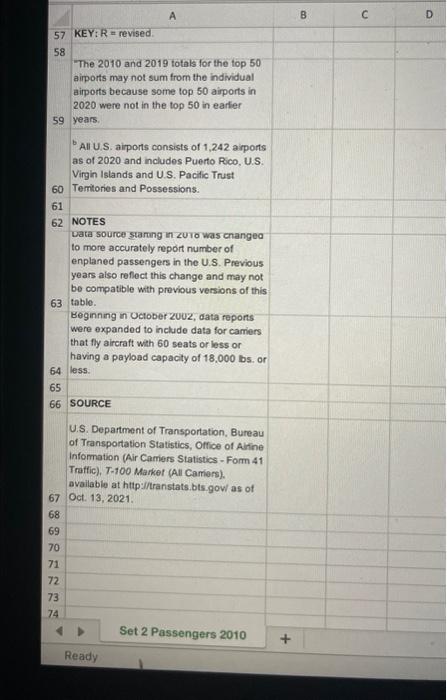
Table 1-44: Passengers Boarded at the Top 50 U.S. Airports 58 "The 2010 and 2019 totals for the top 50 airports may not sum from the individual airports because some top 50 aimports in 2020 were not in the top 50 in eartier 59 years. 'AI U.S. airports consists of 1,242 airports as of 2020 and includes Puerto Rico, U.S, 4 Set 2 Passengers 2010+ Ready 57KEY:R= revised. 58 The 2010 and 2019 totals for the top 50 airports may not sum from the individual airports because some top 50 aiports in 2020 were not in the top 50 in earler 59 year. b All U.S. aiports consists of 1,242 aipports as of 2020 and includes Puerto Rico, U.S. Virgin Islands and U.S. Pacilic Trust 60 Temitories and Possessions. 61 62 NOTES Data source staring in zUTo was cnanged to more accurately report number of enplaned passengers in the U.S. Previous years also reflect this change and may not be compatible with previous versions of this: 63 table. Beginning in Uctober 20u2, data feports were expanded to include data for camiers. that fly aircraft with 60 seats or less or having a payload capacity of 18,000bs. or less. SOURCE U.S. Department of Transportation, Bureau of Transportation Statistics, Office of Aline Infomation (Air Carriers Statistics - Form 41 Traffic), T-100 Market (All Camiers). available at http:i/transtats.btsigowl as of 67 Oct. 13, 2021. 68 69 70 71 72 73 74 Set 2 Passengers 2010 Ready Table 1-44: Passengers Boarded at the Top 50 U.S. Airports 58 "The 2010 and 2019 totals for the top 50 airports may not sum from the individual airports because some top 50 aimports in 2020 were not in the top 50 in eartier 59 years. 'AI U.S. airports consists of 1,242 airports as of 2020 and includes Puerto Rico, U.S, 4 Set 2 Passengers 2010+ Ready 57KEY:R= revised. 58 The 2010 and 2019 totals for the top 50 airports may not sum from the individual airports because some top 50 aiports in 2020 were not in the top 50 in earler 59 year. b All U.S. aiports consists of 1,242 aipports as of 2020 and includes Puerto Rico, U.S. Virgin Islands and U.S. Pacilic Trust 60 Temitories and Possessions. 61 62 NOTES Data source staring in zUTo was cnanged to more accurately report number of enplaned passengers in the U.S. Previous years also reflect this change and may not be compatible with previous versions of this: 63 table. Beginning in Uctober 20u2, data feports were expanded to include data for camiers. that fly aircraft with 60 seats or less or having a payload capacity of 18,000bs. or less. SOURCE U.S. Department of Transportation, Bureau of Transportation Statistics, Office of Aline Infomation (Air Carriers Statistics - Form 41 Traffic), T-100 Market (All Camiers). available at http:i/transtats.btsigowl as of 67 Oct. 13, 2021. 68 69 70 71 72 73 74 Set 2 Passengers 2010 Ready


