

Answered step by step
Verified Expert Solution
Question
1 Approved Answer
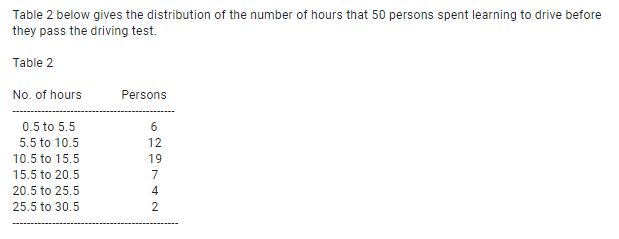
Table 2 below gives the distribution of the number of hours that 50 persons spent learning to drive before they pass the driving test. Table


Step by Step Solution
There are 3 Steps involved in it
Step: 1

Get Instant Access to Expert-Tailored Solutions
See step-by-step solutions with expert insights and AI powered tools for academic success
Step: 2

Step: 3
Ace Your Homework with AI
Get the answers you need in no time with our AI-driven, step-by-step assistance
Get Started
Elementary Number Theory
Authors: Gove Effinger, Gary L Mullen
1st Edition
1000427129, 9781000427127