Question
The file P02_26.xlsx lists sales (in millions of dollars) of Dell Computer during the period 19871997 (where year 1 corresponds to 1987). a. Fit a
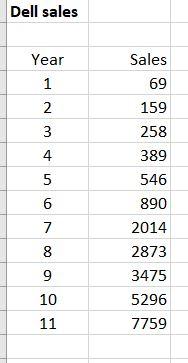
The file P02_26.xlsx lists sales (in millions of dollars) of Dell Computer during the period 1987–1997 (where year 1 corresponds to 1987).

a. Fit a power and an exponential trend curve to these data. Which fits the data better?
b. Use your part a answer to predict 1999 sales for Dell.
c. Use your part a answer to describe how the sales of Dell have grown from year to year.
d. Search the Web for more recent Dell sales data. Then repeat the preceding parts using all of the data.
Dell sales Year Sales 1 69 159 258 4 389 546 890 7 2014 8 2873 9 3475 10 5296 11 7759
Step by Step Solution
There are 3 Steps involved in it
Step: 1

Get Instant Access to Expert-Tailored Solutions
See step-by-step solutions with expert insights and AI powered tools for academic success
Step: 2

Step: 3

Ace Your Homework with AI
Get the answers you need in no time with our AI-driven, step-by-step assistance
Get StartedRecommended Textbook for
Statistical Techniques In Business And Economics
Authors: Douglas Lind, William Marchal, Samuel Wathen
18th Edition
1260239470, 978-1260239478
Students also viewed these Mathematics questions
Question
Answered: 1 week ago
Question
Answered: 1 week ago
Question
Answered: 1 week ago
Question
Answered: 1 week ago
Question
Answered: 1 week ago
Question
Answered: 1 week ago
Question
Answered: 1 week ago
Question
Answered: 1 week ago
Question
Answered: 1 week ago
Question
Answered: 1 week ago
Question
Answered: 1 week ago
Question
Answered: 1 week ago
Question
Answered: 1 week ago
Question
Answered: 1 week ago
Question
Answered: 1 week ago
Question
Answered: 1 week ago
Question
Answered: 1 week ago
Question
Answered: 1 week ago
Question
Answered: 1 week ago
Question
Answered: 1 week ago
Question
Answered: 1 week ago
Question
Answered: 1 week ago
Question
Answered: 1 week ago
View Answer in SolutionInn App


