

Answered step by step
Verified Expert Solution
Question
1 Approved Answer
Table 2: Market Quantity Supplied and Demanded Data for Good X Market Quantity Quantity Prices | Supplied Demanded P) (O) (od S4.00 4 10 $5.00
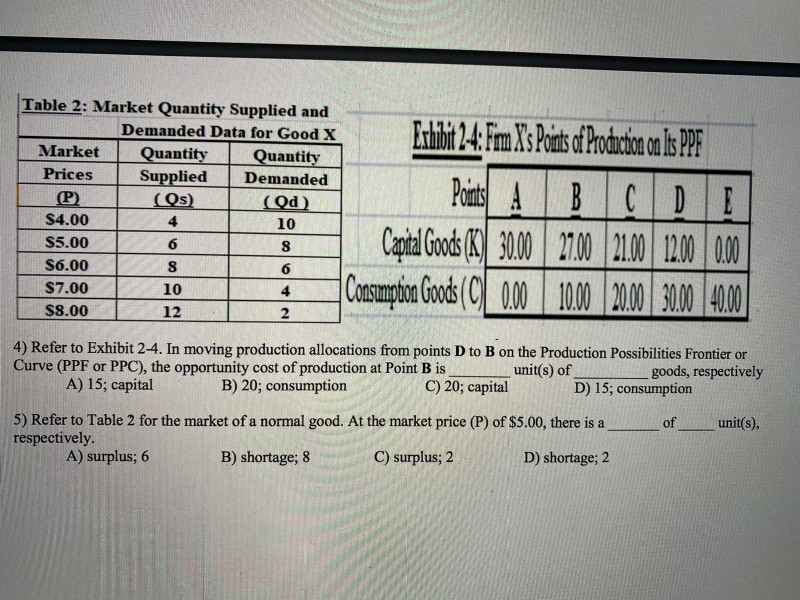
Table 2: Market Quantity Supplied and Demanded Data for Good X Market Quantity Quantity Prices | Supplied Demanded P) (O) (od S4.00 4 10 $5.00 6 8 S6.00 $7.00 10 $8.00 12 Exhibit 2.4: Fim X's Points of Production on Iis PPF Points ABCD Capital Goods (K) 30,00 27.00 21.00 12.000.00 Consumption Goods (C) 0.00 10.00 20.00 | 30.00 40.00 4) Refer to Exhibit 2-4. In moving production allocations from points D to B on the Production Possibilities Frontier or Curve (PPF or PPC), the opportunity cost of production at Point B is_ unit(s) of _goods, respectively A) 15; capital B) 20; consumption C) 20; capital D) 15; consumption of unit(s), 5) Refer to Table 2 for the market of a normal good. At the market price (P) of $5.00, there is a respectively. A) surplus; 6 B) shortage; 8 C) surplus; 2 D) shortage; 2
Step by Step Solution
There are 3 Steps involved in it
Step: 1

Get Instant Access to Expert-Tailored Solutions
See step-by-step solutions with expert insights and AI powered tools for academic success
Step: 2

Step: 3
Ace Your Homework with AI
Get the answers you need in no time with our AI-driven, step-by-step assistance
Get Started
Statistical Analysis Microsoft Excel 2010
Authors: Conrad Carlberg
1st Edition
0789747200, 9780789747204