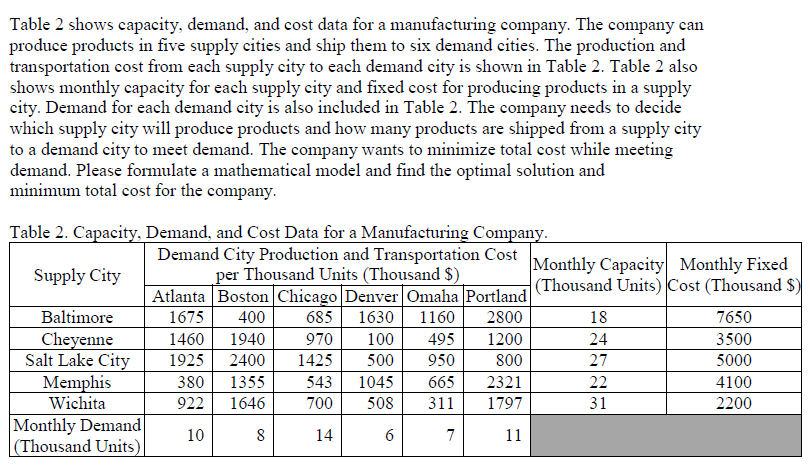
Table 2 shows capacity, demand, and cost data for a manufacturing company. The company can produce products in five supply cities and ship them to six demand cities. The production and transportation cost from each supply city to each demand city is shown in Table 2. Table 2 also shows monthly capacity for each supply city and fixed cost for producing products in a supply city. Demand for each demand city is also included in Table 2. The company needs to decide which supply city will produce products and how many products are shipped from a supply city to a demand city to meet demand. The company wants to minimize total cost while meeting demand. Please formulate a mathematical model and find the optimal solution and minimum total cost for the company. Table 2. Capacity, Demand, and Cost Data for a Manufacturing Company. Demand City Production and Transportation Cost Supply City per Thousand Units (Thousand $). Monthly Capacity Monthly Fixed Atlanta Boston Chicago Denver Omaha Portland (Thousand Units) Cost (Thousand $) Baltimore 1675 400 685 1630 1160 2800 18 7650 Cheyenne 1460 1940 970 100 495 1200 24 3500 Salt Lake City 1925 2400 1425 500 950 800 27 5000 Memphis 380 1355 543 1045 665 2321 22 4100 Wichita 922 1646 700 508 311 1797 31 2200 Monthly Demand 10 8 14 6 7 11 (Thousand Units) Table 2 shows capacity, demand, and cost data for a manufacturing company. The company can produce products in five supply cities and ship them to six demand cities. The production and transportation cost from each supply city to each demand city is shown in Table 2. Table 2 also shows monthly capacity for each supply city and fixed cost for producing products in a supply city. Demand for each demand city is also included in Table 2. The company needs to decide which supply city will produce products and how many products are shipped from a supply city to a demand city to meet demand. The company wants to minimize total cost while meeting demand. Please formulate a mathematical model and find the optimal solution and minimum total cost for the company. Table 2. Capacity, Demand, and Cost Data for a Manufacturing Company. Demand City Production and Transportation Cost Supply City per Thousand Units (Thousand $). Monthly Capacity Monthly Fixed Atlanta Boston Chicago Denver Omaha Portland (Thousand Units) Cost (Thousand $) Baltimore 1675 400 685 1630 1160 2800 18 7650 Cheyenne 1460 1940 970 100 495 1200 24 3500 Salt Lake City 1925 2400 1425 500 950 800 27 5000 Memphis 380 1355 543 1045 665 2321 22 4100 Wichita 922 1646 700 508 311 1797 31 2200 Monthly Demand 10 8 14 6 7 11 (Thousand Units)