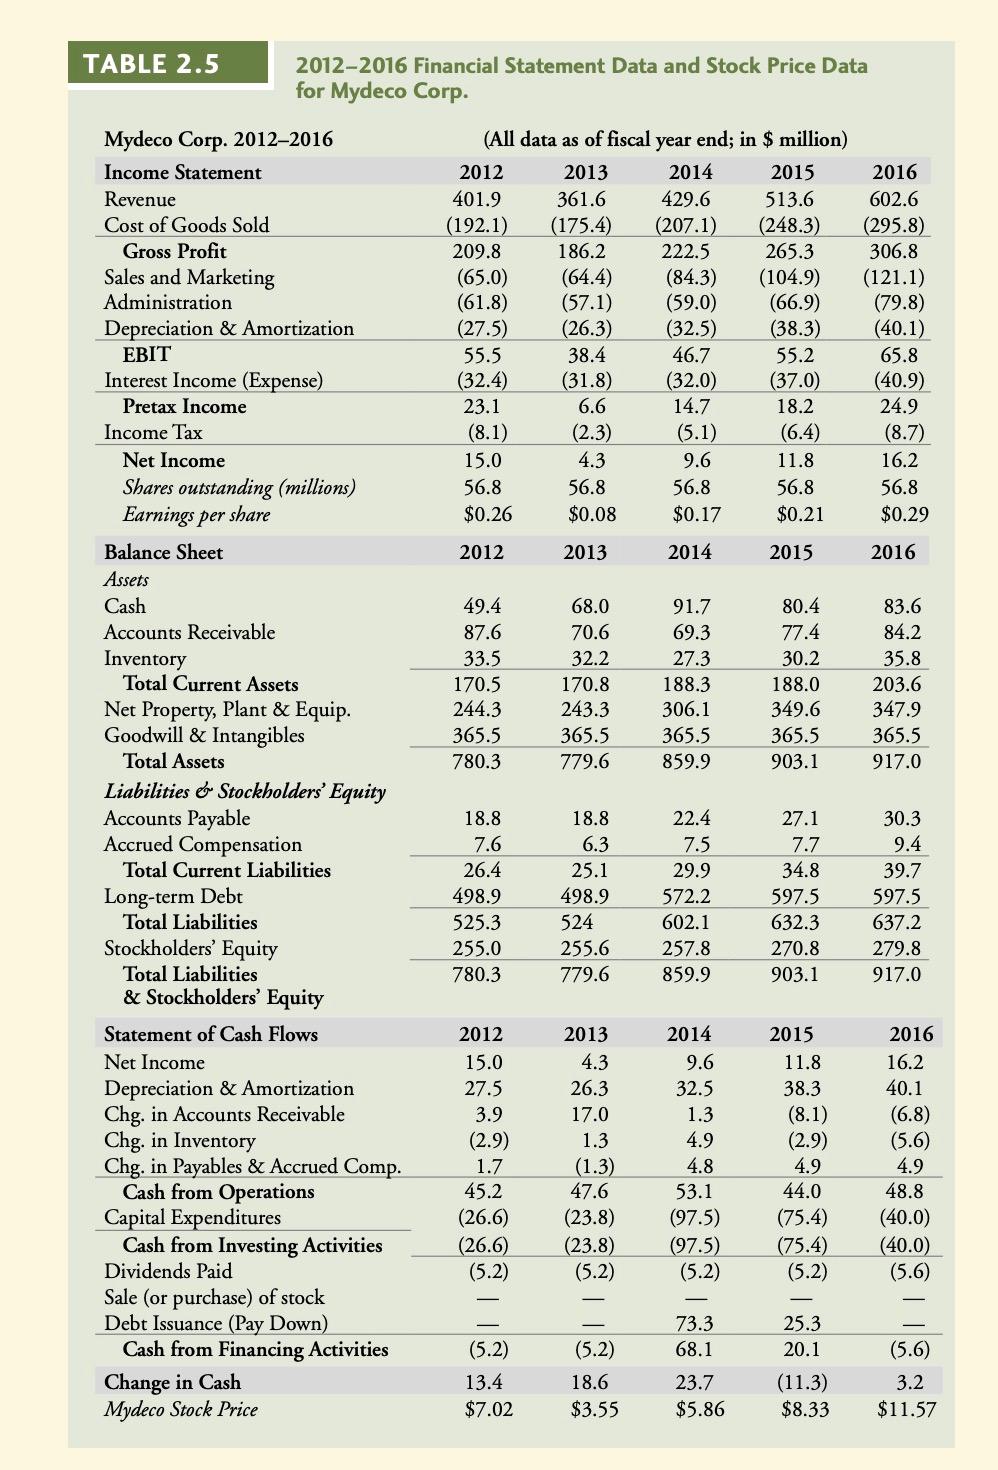
TABLE 2.5 2012-2016 Financial Statement Data and Stock Price Data for Mydeco Corp. Mydeco Corp. 2012-2016 Income Statement Revenue Cost of Goods Sold Gross Profit Sales and Marketing Administration Depreciation & Amortization (All data as of fiscal year end; in $ million) 2012 2013 2014 2015 401.9 361.6 429.6 513.6 (192.1) (175.4) (207.1) (248.3) 209.8 186.2 222.5 265.3 (65.0) (64.4) (84.3) (104.9) (61.8) (57.1) (59.0) (66.9) (27.5) (26.3) (32.5) (38.3) 55.5 38.4 46.7 55.2 (32.4) (31.8) (32.0) (37.0) 23.1 6.6 14.7 18.2 (8.1) (2.3) (5.1) (6.4) 15.0 4.3 9.6 11.8 56.8 56.8 56.8 56.8 $0.26 $0.08 $0.17 $0.21 2016 602.6 (295.8) 306.8 (121.1) (79.8) (40.1) 65.8 (40.9) 24.9 (8.7) 16.2 56.8 $0.29 EBIT 2012 2013 2014 2015 2016 49.4 87.6 33.5 170.5 244.3 365.5 780.3 68.0 70.6 32.2 170.8 243.3 365.5 779.6 91.7 69.3 27.3 188.3 306.1 365.5 859.9 80.4 77.4 30.2 188.0 349.6 365.5 903.1 83.6 84.2 35.8 203.6 347.9 365.5 917.0 18.8 6.3 Interest Income (Expense) Pretax Income Income Tax Net Income Shares outstanding (millions) Earnings per share Balance Sheet Assets Cash Accounts Receivable Inventory Total Current Assets Net Property, Plant & Equip. Goodwill & Intangibles Total Assets Liabilities & Stockholders' Equity Accounts Payable Accrued Compensation Total Current Liabilities Long-term Debt Total Liabilities Stockholders' Equity Total Liabilities & Stockholders' Equity Statement of Cash Flows Net Income Depreciation & Amortization Chg. in Accounts Receivable Chg. in Inventory Chg. in Payables & Accrued Comp. Cash from Operations Capital Expenditures Cash from Investing Activities Dividends Paid Sale (or purchase) of stock Debt Issuance (Pay Down) Cash from Financing Activities Change in Cash Mydeco Stock Price 18.8 7.6 26.4 498.9 525.3 255.0 780.3 25.1 498.9 524 255.6 779.6 22.4 7.5 29.9 572.2 602.1 257.8 859.9 27.1 7.7 34.8 597.5 632.3 270.8 903.1 30.3 9.4 39.7 597.5 637.2 279.8 917.0 2012 15.0 27.5 3.9 (2.9) 1.7 45.2 (26.6) (26.6 (5.2) 2013 4.3 26.3 17.0 1.3 (1.3) 47.6 (23.8) (23.8) (5.2) 2014 9.6 32.5 1.3 4.9 4.8 53.1 (97.5) (97.5) (5.2) 2015 11.8 38.3 (8.1) (2.9) 4.9 44.0 (75.4) (75.4) (5.2) 2016 16.2 40.1 (6.8) (5.6) 4.9 48.8 (40.0) (40.0) (5.6) 73.3 68.1 (5.2) 13.4 $7.02 (5.2) 18.6 $3.55 25.3 20.1 (11.3) $8.33 23.7 $5.86 (5.6) 3.2 $11.57 X 20. See Table 2.5 showing financial statement data and stock price data for Mydeco Corp. From 2012 to 2016, what was the total cash flow from operations that Mydeco generated? b. What fraction of the total in (a) was spent on capital expenditures? c. What fraction of the total in (a) was spent paying dividends to shareholders? 1. What was Mydeco's total retained earnings for this period? 21. See Table 2.5 showing financial statement data and stock price data for Mydeco Corp. a In what year was Mydeco's net income the lowest? H. In what year did Mydeco need to reduce its cash reserves? Why did Mydeco need to reduce its cash reserves in a year when net income was reasonably high? 22. See Table 2.5 showing financial statement data and stock price data for Mydeco Corp. Use the data from the balance sheet and cash flow statement in 2012 to determine the following: a. How much cash did Mydeco have at the end of 2011? b. What were Mydeco's accounts receivable and inventory at the end of 2011? c. What were Mydeco's total liabilities at the end of 2011? d. Assuming goodwill and intangibles were equal in 2011 and 2012, what was Mydeco's net property, plant, and equipment at the end of 2011