

Answered step by step
Verified Expert Solution
Question
1 Approved Answer
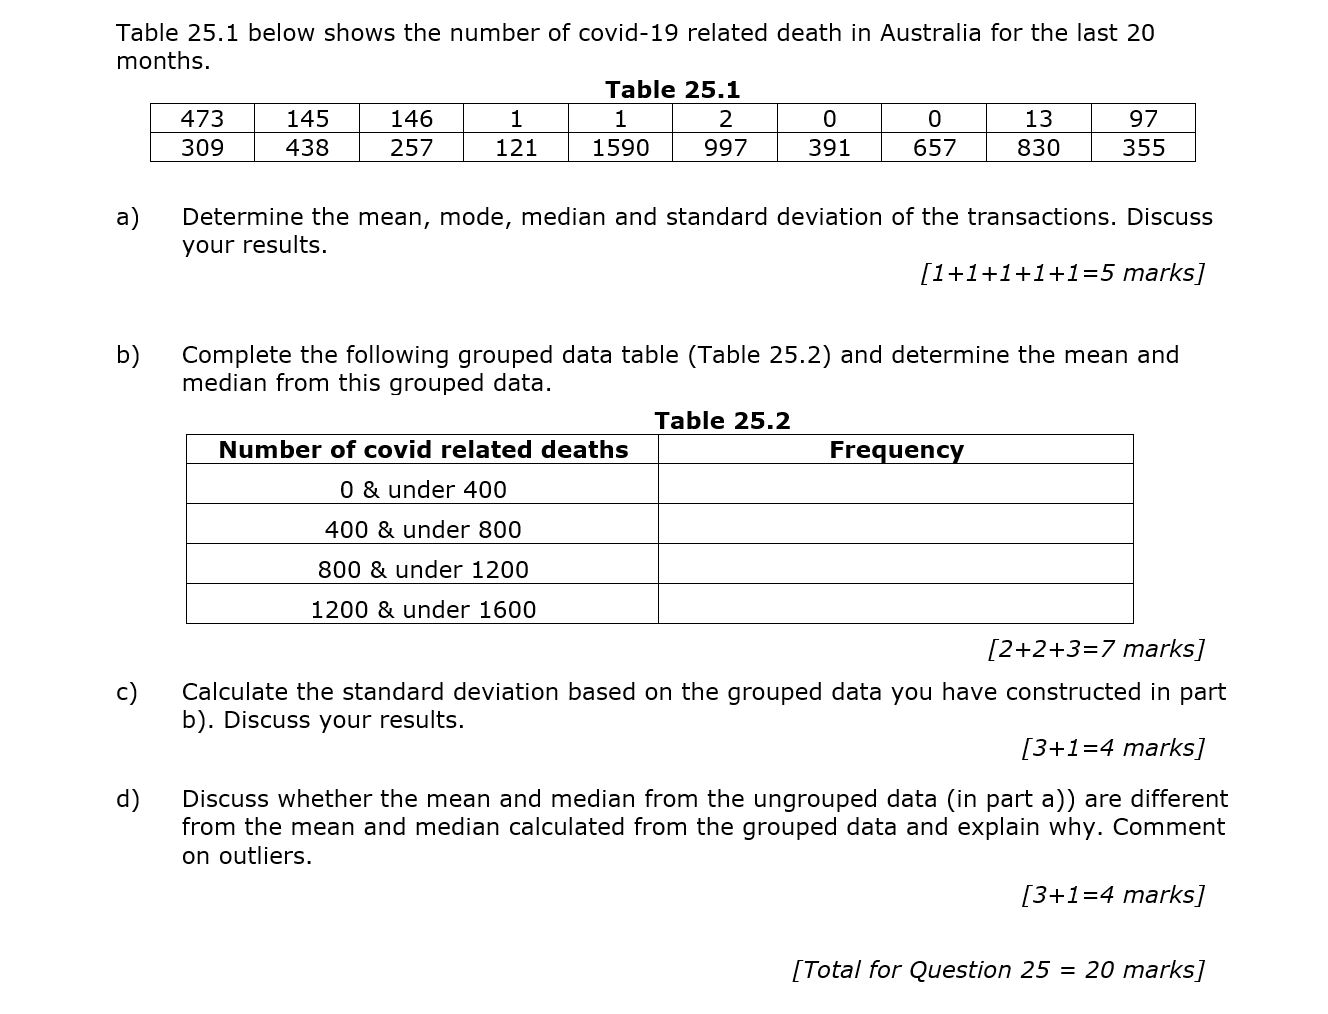
Table 25.1 below shows the number of covid-19 related death in Australia for the last 20 months. b) 6) Table 25.1 473 145 146 1

Step by Step Solution
There are 3 Steps involved in it
Step: 1

Get Instant Access to Expert-Tailored Solutions
See step-by-step solutions with expert insights and AI powered tools for academic success
Step: 2

Step: 3
Ace Your Homework with AI
Get the answers you need in no time with our AI-driven, step-by-step assistance
Get Started
Smooth Manifolds
Authors: Rajnikant Sinha
1st Edition
8132221044, 9788132221043