

Answered step by step
Verified Expert Solution
Question
1 Approved Answer
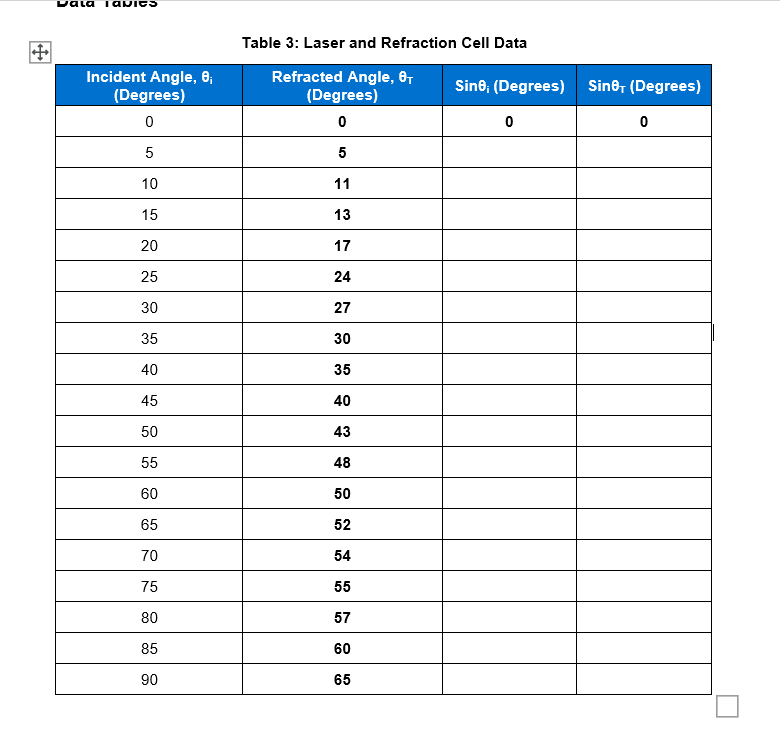
Table 3: Laser and Refraction Cell Data Incident Angle, 0; Refracted Angle, OT Degrees) Degrees) Sin0; (Degrees) Sin0 (Degrees) 0 0 0 0 5 5
Step by Step Solution
There are 3 Steps involved in it
Step: 1

Get Instant Access to Expert-Tailored Solutions
See step-by-step solutions with expert insights and AI powered tools for academic success
Step: 2

Step: 3
Ace Your Homework with AI
Get the answers you need in no time with our AI-driven, step-by-step assistance
Get Started
Optical Properties Of Materials And Their Applications
Authors: Jai Singh, Peter Capper
2nd Edition
1119506050, 9781119506058