

Question: Table 3. (Use Logger Pro for statistical data to calculate avg. velocity and uncertainty) Run # Average Velocity, (units) Standard deviation (units) 2 Insert positions
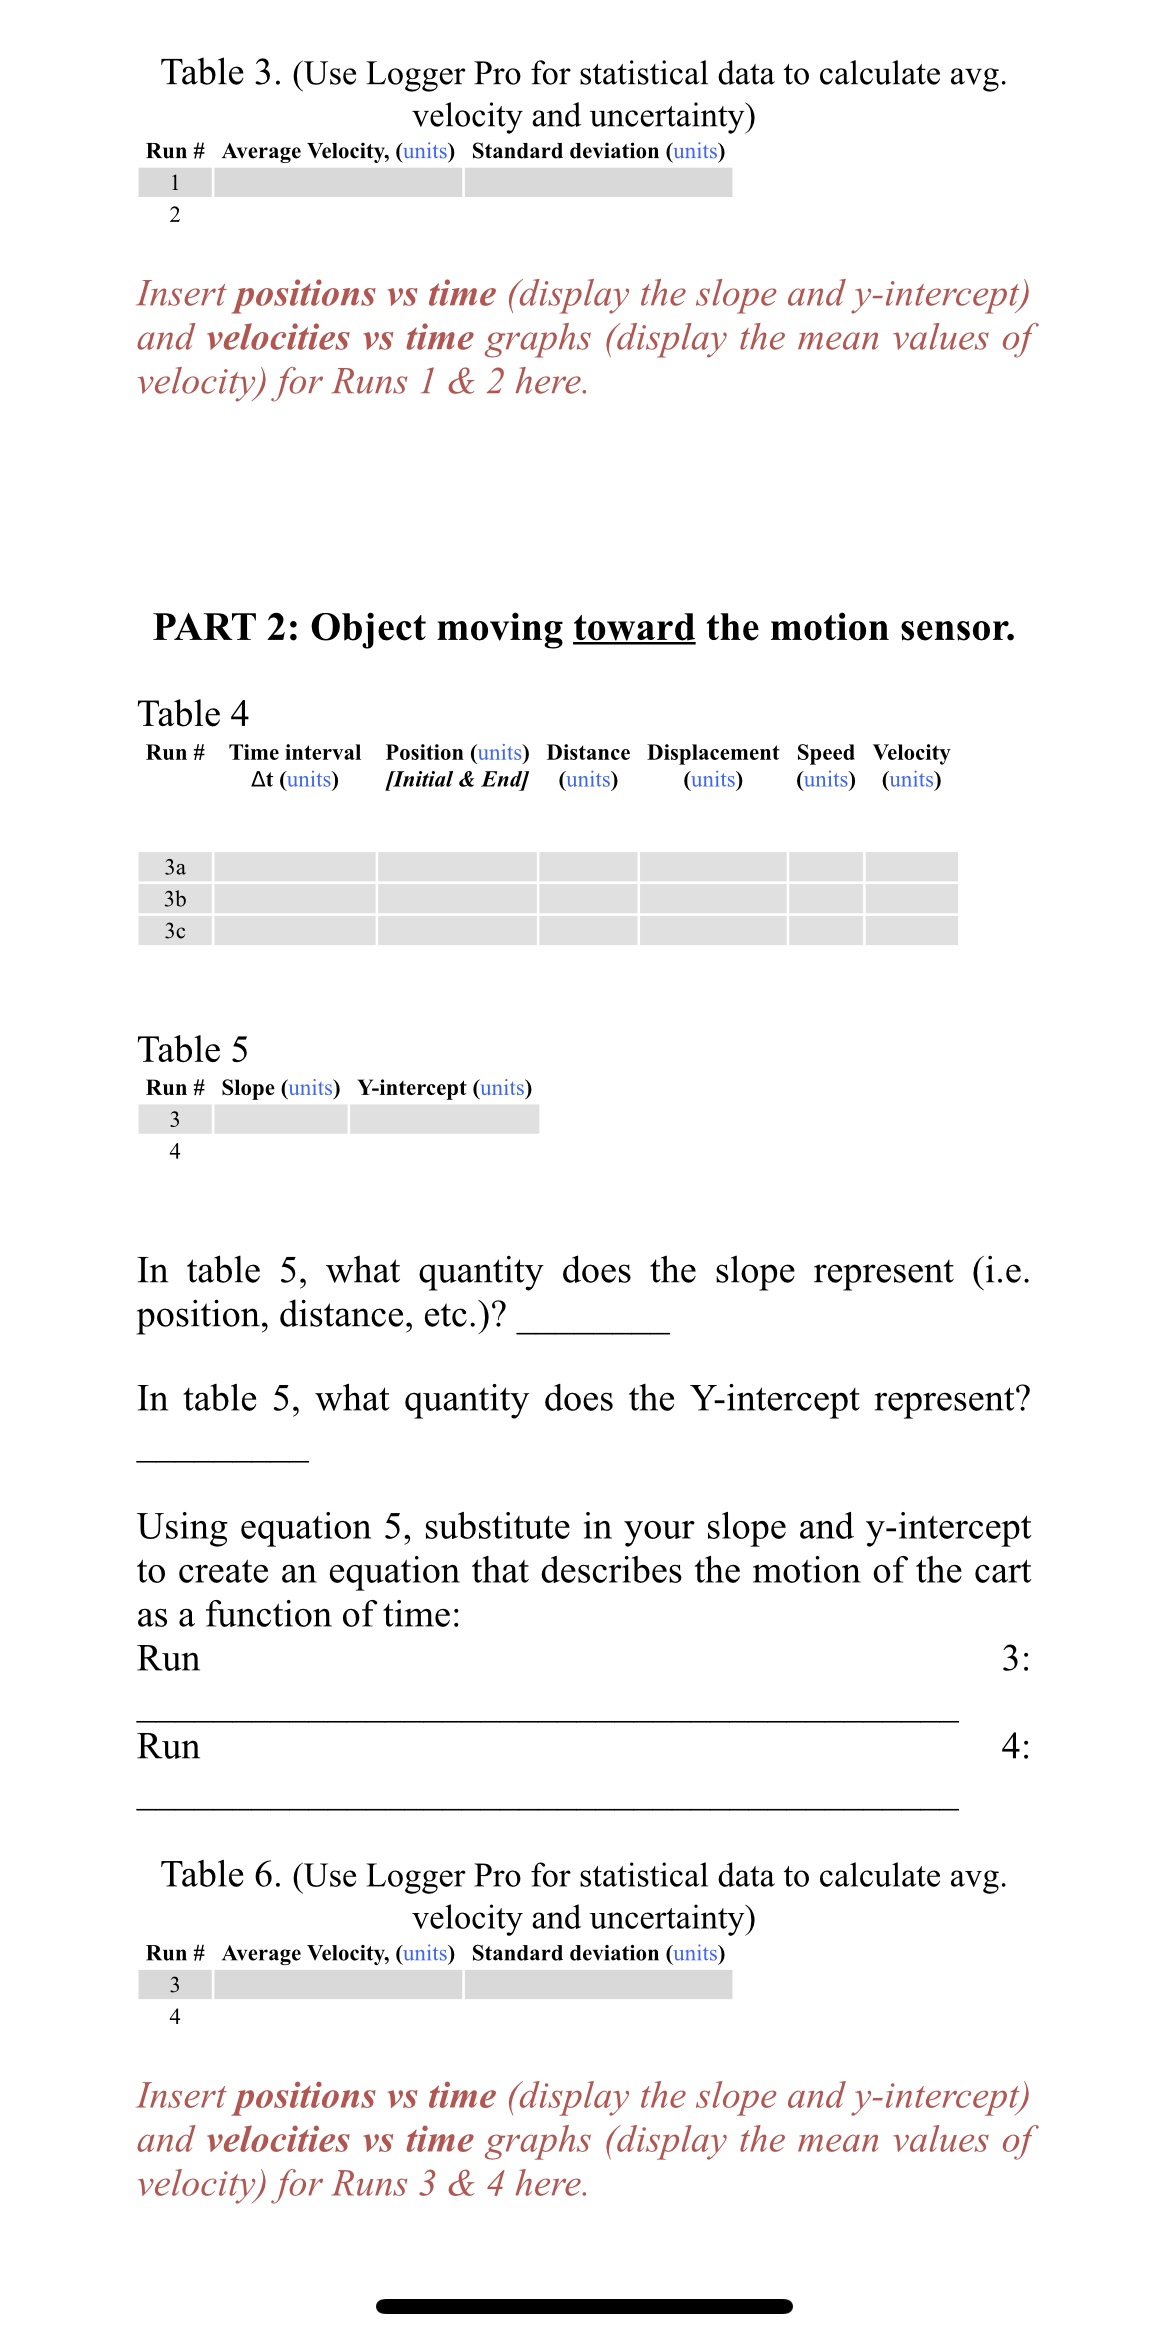
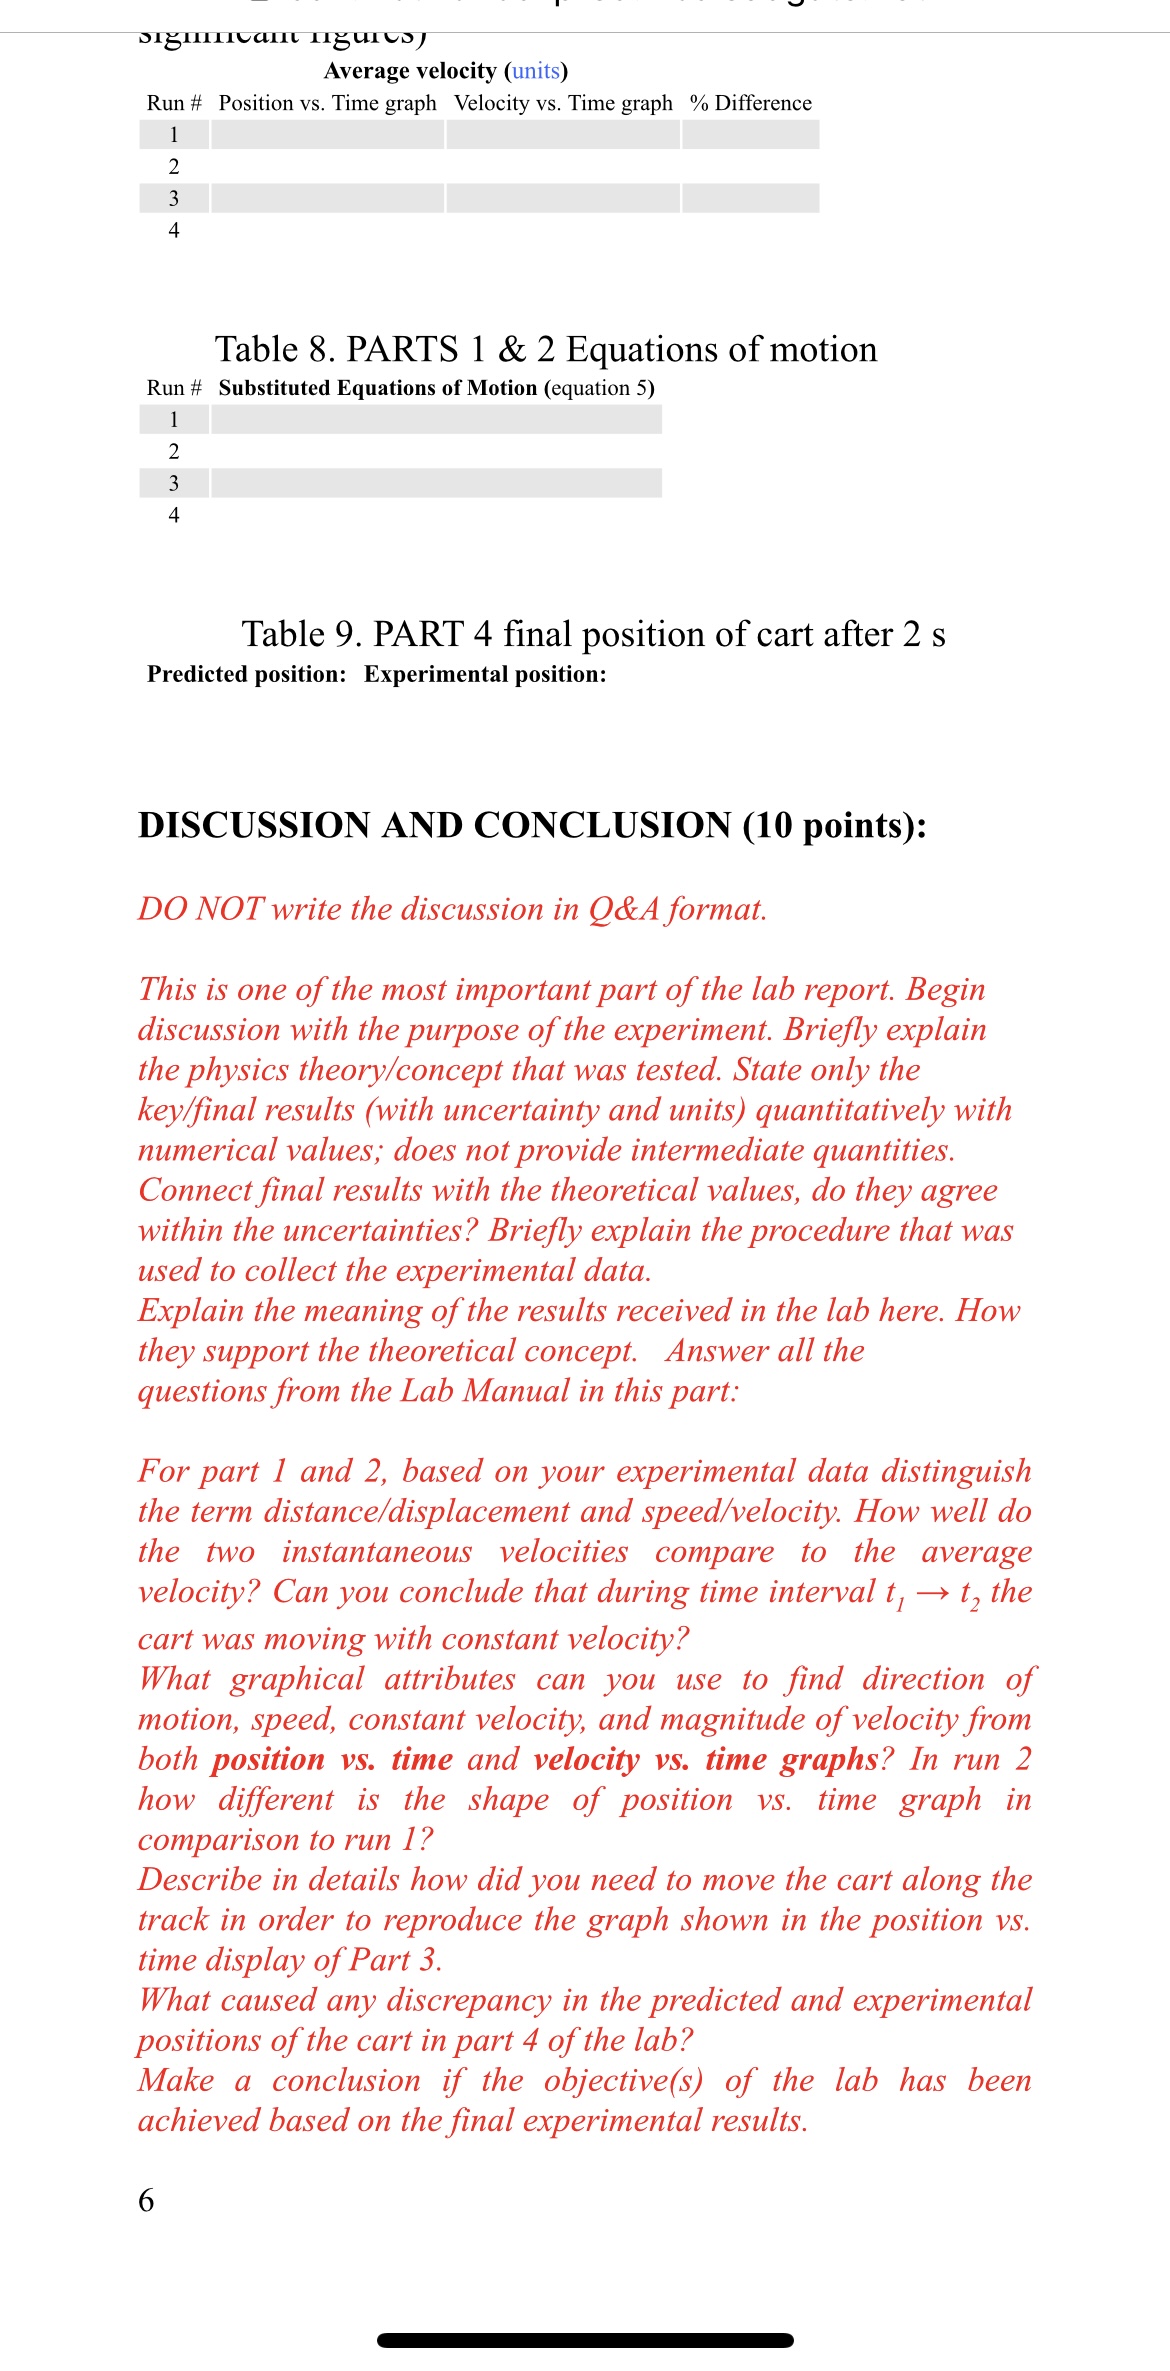
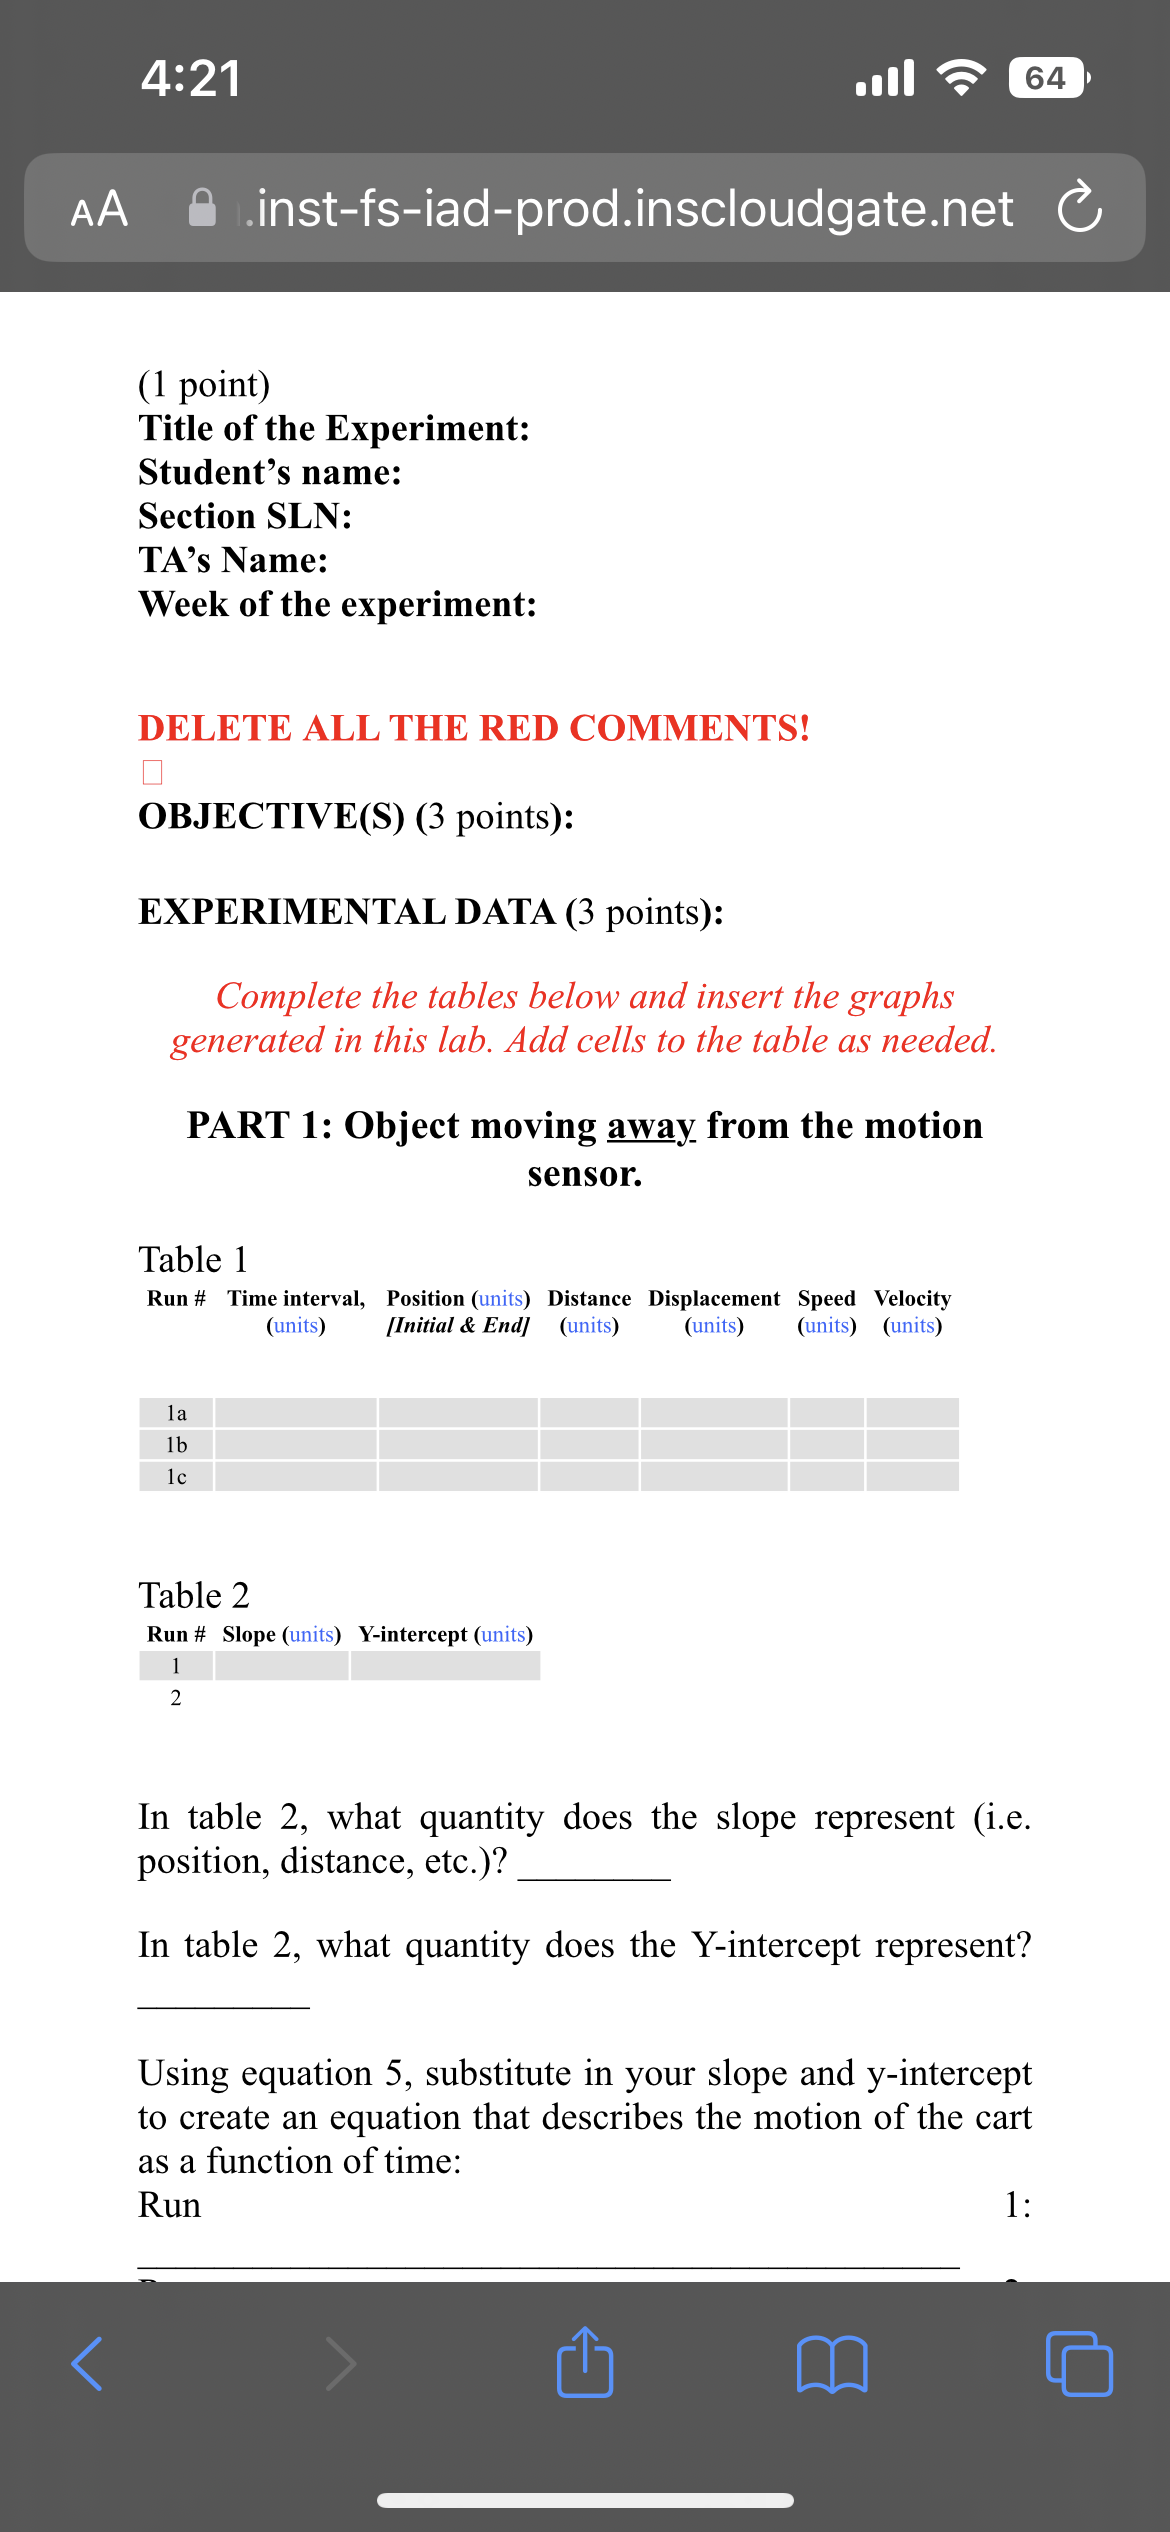
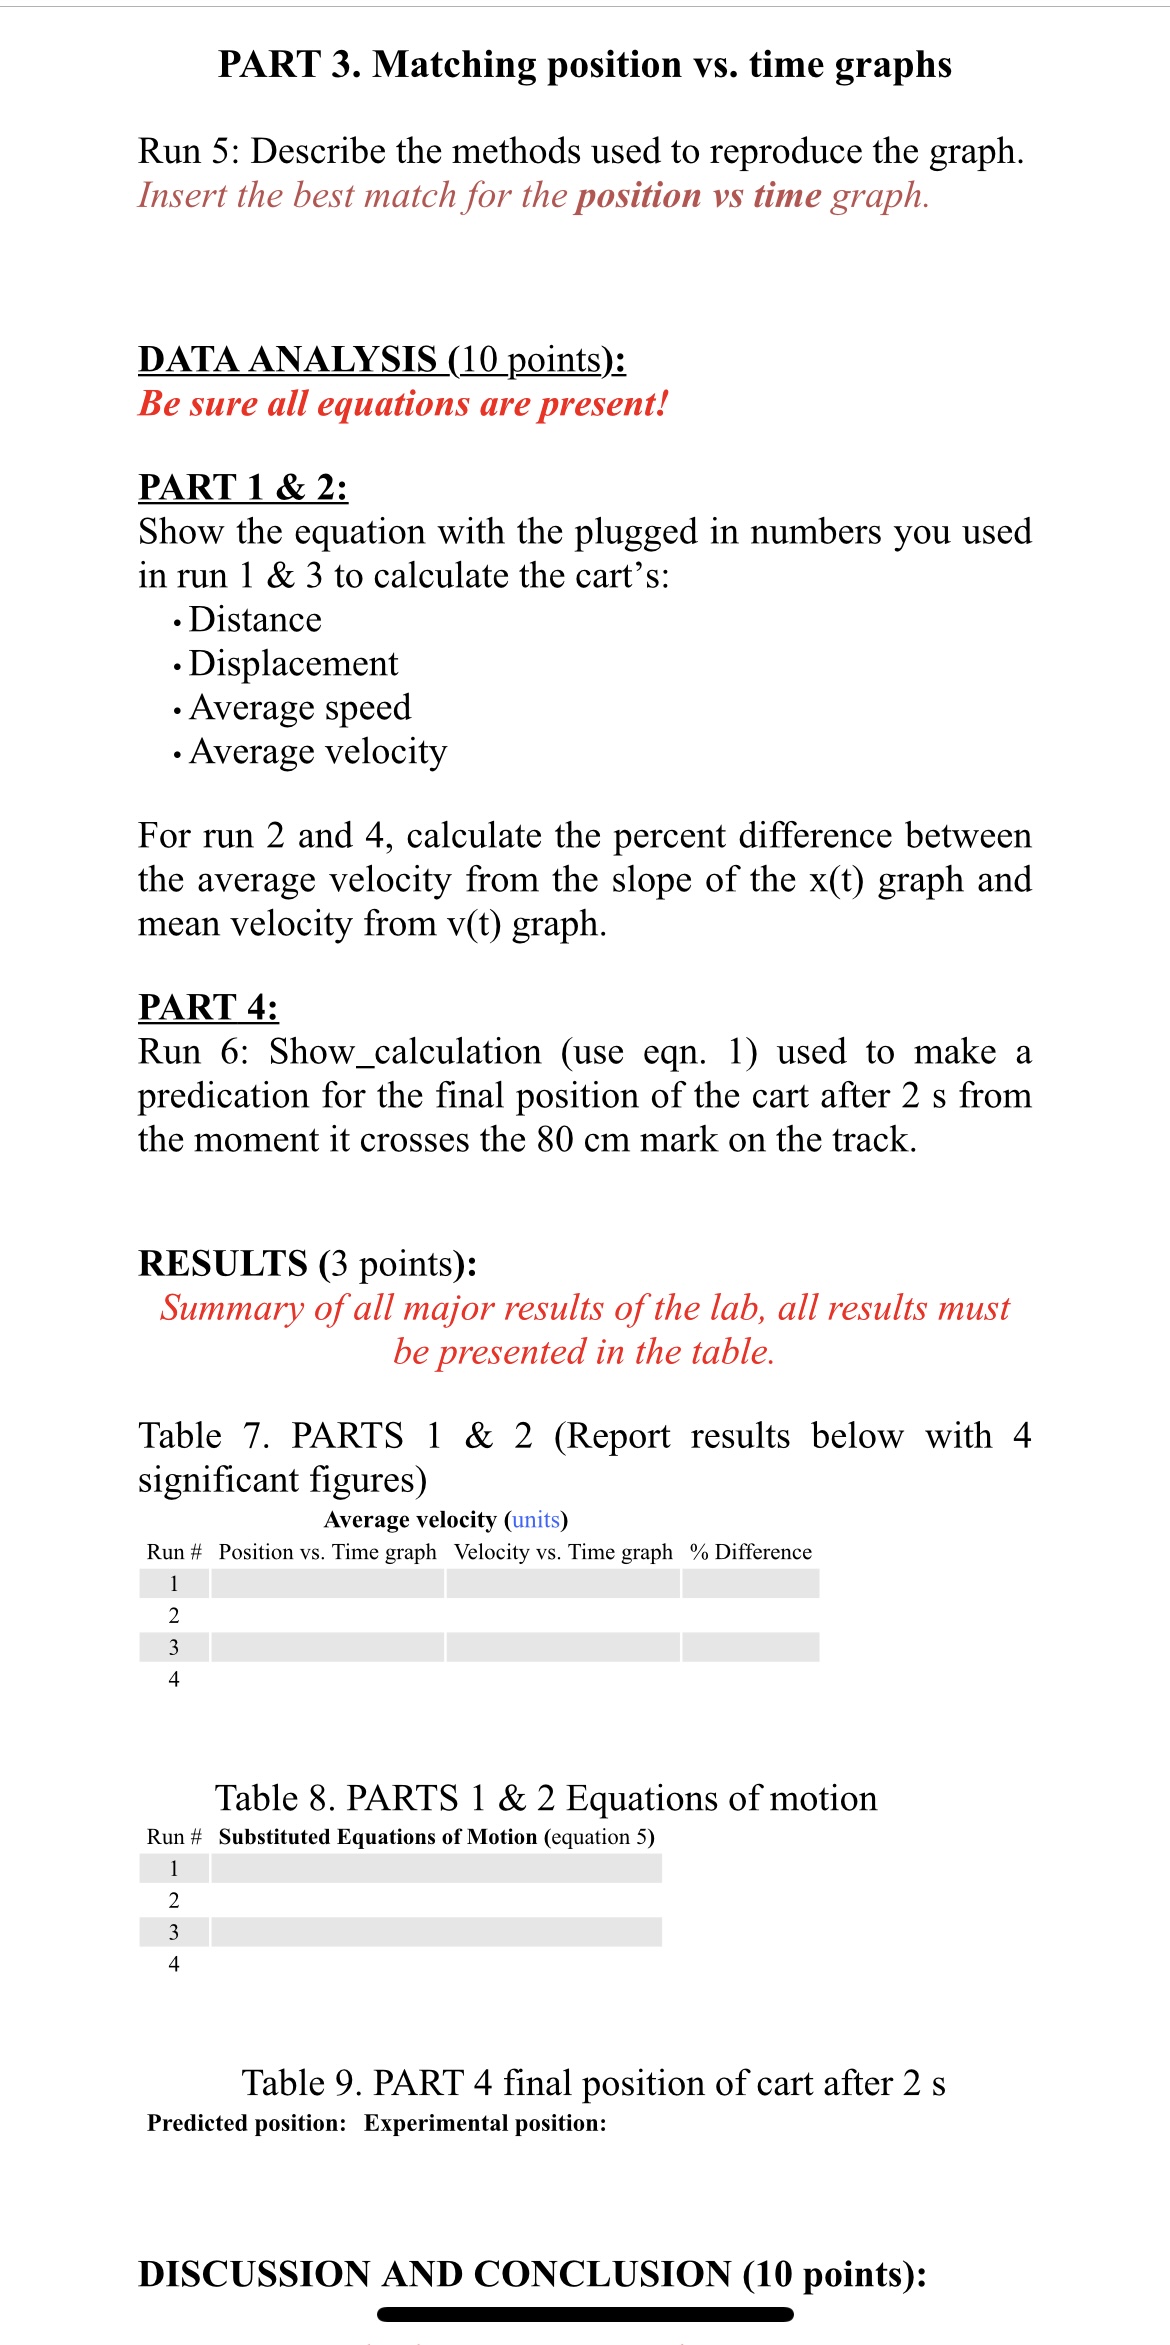
Table 3. (Use Logger Pro for statistical data to calculate avg. velocity and uncertainty) Run # Average Velocity, (units) Standard deviation (units) 2 Insert positions vs time (display the slope and y-intercept) and velocities vs time graphs (display the mean values of velocity) for Runs 1 & 2 here. PART 2: Object moving toward the motion sensor. Table 4 Run # Time interval Position (units) Distance Displacement Speed Velocity At (units) [Initial & End) (units) (units) (units) (units) 3a 3b 3c Table 5 Run # Slope (units) Y-intercept (units) 3 4 In table 5, what quantity does the slope represent (i.e. position, distance, etc.)? In table 5, what quantity does the Y-intercept represent? Using equation 5, substitute in your slope and y-intercept to create an equation that describes the motion of the cart as a function of time: Run 3: Run 4: Table 6. (Use Logger Pro for statistical data to calculate avg. velocity and uncertainty) Run # Average Velocity, (units) Standard deviation (units) 3 4 Insert positions vs time (display the slope and y-intercept) and velocities vs time graphs (display the mean values of velocity) for Runs 3 & 4 here.alslllLIUallL 115 L11 U0) Average velocity (units) Run # Position vs. Time graph Velocity vs. Time graph % Difference 1 2 3 4 Table 8. PARTS 1 & 2 Equations of motion Run # Substituted Equations of Motion (equation 5) 1 2 3 4 Table 9. PART 4 nal position of cart after 2 3 Predicted position: Experimental position: DISCUSSION AND CONCLUSION (10 points): DO NOT write the discussion in Q&A format. This is one of the most important part of the lab report. Begin discussion with the purpose of the experiment. Briey explain the physics theory/concept that was tested. State only the keylnal results (with uncertainty and units) quantitatively with numerical values; does not provide intermediate quantities. Connect final results with the theoretical values, do they agree within the uncertainties? Briey explain the procedure that was used to collect the experimental data. Explain the meaning of the results received in the lab here. How they support the theoretical concept. Answer all the questions from the Lab Manual in this part: For part 1 and 2, based on your experimental data distinguish the term distance/displacement and speed/velocity. How well do the two instantaneous velocities compare to the average velocity? Can you conclude that during time interval t] > t2 the cart was moving with constant velocity? What graphical attributes can you use to find direction of motion, speed, constant velocity, and magnitude ofvelocity from both position vs. time and velocity vs. time graphs? In run 2 how different is the shape of position vs. time graph in comparison to run 1? Describe in details how didyou need to move the cart along the track in order to reproduce the graph shown in the position vs. time display of Part 3. What caused any discrepancy in the predicted and experimental positions of the cart in part 4 of the lab? Make a conclusion if the objective(s) of the lab has been achieved based on the nal experimental results. 6 4221 ml '3' El AA 8 .inst-fs-iad-prod.inscloudgate.net CL ( 1 point) Title of the Experiment: Student's name: Section SLN: TA's Name: Week of the experiment: DELETE ALL THE RED COMMENTS! OBJECTIVE(S) (3 points): EXPERIMENTAL DATA (3 points): Complete the tables below and insert the graphs generated in this lab. Add cells to the table as needed. PART 1: Object moving away from the motion sensor. Table 1 Run# Time interval, Position (units) Distance Displacement Speed Velocity (units) [Initial&End] (units) (units) (units) (units) 113 1c Table 2 Run # Slope (units) Yintercept (units) 1 2 In table 2, what quantity does the slope represent (i.e. position, distance, etc)? In table 2, what quantity does the Yintercept represent? Using equation 5, substitute in your slope and yintercept to create an equation that describes the motion of the cart as a function of time: Run 1: PART 3. Matching position vs. time graphs Run 5: Describe the methods used to reproduce the graph. Insert the best match for the position vs time graph. DATA ANALYSIS (10 points): Be sure all equations are present! PART 1 & 2: Show the equation with the plugged in numbers you used in run 1 & 3 to calculate the cart's: . Distance . Displacement . Average speed . Average velocity For run 2 and 4, calculate the percent difference between the average velocity from the slope of the x(t) graph and mean velocity from v(t) graph. PART 4: Run 6: Show_calculation (use eqn. 1) used to make a predication for the final position of the cart after 2 s from the moment it crosses the 80 cm mark on the track. RESULTS (3 points): Summary of all major results of the lab, all results must be presented in the table. Table 7. PARTS 1 & 2 (Report results below with 4 significant figures) Average velocity (units) Run # Position vs. Time graph Velocity vs. Time graph % Difference A W N Table 8. PARTS 1 & 2 Equations of motion Run # Substituted Equations of Motion (equation 5) N A W Table 9. PART 4 final position of cart after 2 s Predicted position: Experimental position: DISCUSSION AND CONCLUSION (10 points)
Step by Step Solution
There are 3 Steps involved in it

Get step-by-step solutions from verified subject matter experts