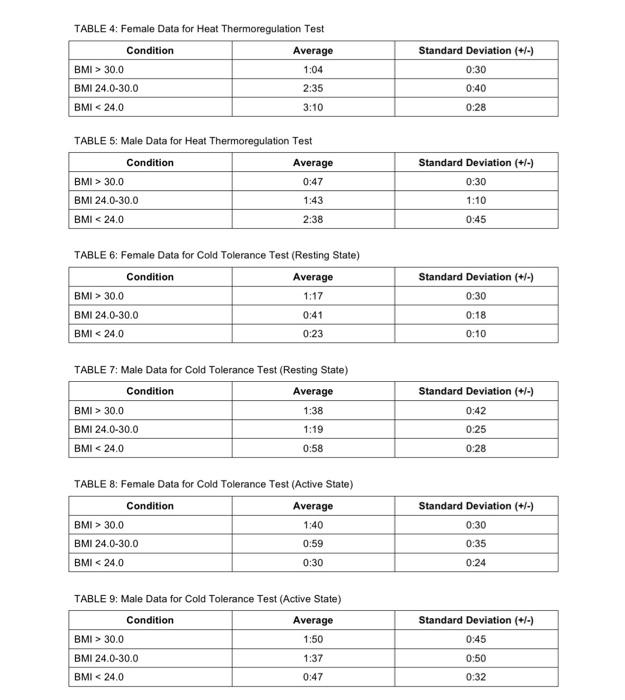
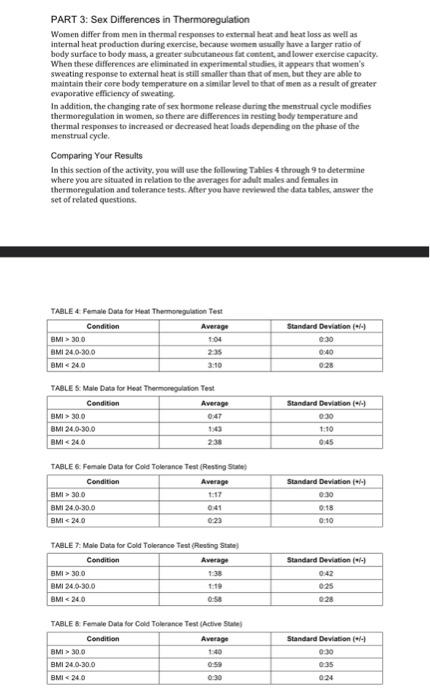
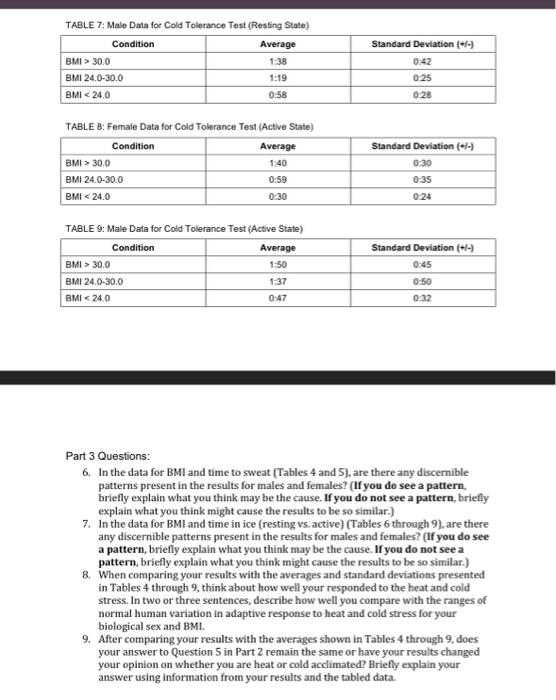
TABLE 4: Female Data for Heat Thermoregulation Test TABLE 5: Male Data for Heat Thermoregulation Test TABLE 6: Female Data for Cold Tolerance Test (Resting State) TABLE 7: Male Data for Cold Tolerance Test (Resting State) TABLE 8: Female Data for Cold Tolerance Test (Active State) TABLE 9: Male Data for Cold Tolerance Test (Active State) Part 3 Questions: 6. In the data for BMI and time to sweat (Tables 4 and 5), are there any discernible patterns present in the results for males and females? (If you do see a pattern, briefly explain what you think may be the cause. If you do not see a pattern, briefly explain what you think might cause the results to be so similar.) 7. In the data for BMI and time in ice (resting vs, active) (Tables 6 through 9), are there any discernible patterns present in the results for males and females? (If you do see a pattern, briefly explain what you think may be the cause. If you do not see a pattern, briefly explain what you think might cause the results to be so similar.) 8. When comparing your results with the averages and standard deviations presented in Tables 4 through 9, think about how well your responded to the heat and cold stress. In two or three sentences, describe how well you compare with the ranges of normal human variation in adaptive response to heat and cold stress for your biological sex and BMI. 9. After comparing your results with the averages shown in Tables 4 through 9, does your answer to Question 5 in Part 2 remain the same or have your results changed your opinion on whether you are heat or cold acclimated? Briefly explain your answer using information from your results and the tabled data. PART 3: Sex Differences in Thermoregulation Women differ from men in thermal responses to ecternul heat and heat loss as well as internal heat production during exercise, because women aseally have a larger ratio of body surface to body mass a greater subcutaneous fit content, and lower evercise capacity. When these differences are eliminated in experimental studies, it appears that women's sweating response to external heat is stili smaller thun that of men but they are able to maibtain their core body temperature en a simillar level to that of men as a result of greater evaporative efficiency of sweating In addition, the changing rate of sex hormone release during the menstrual cycle modifies thermoregulation in women, so there are differences in resting body temperature and thermal responses to increased or decreased heat louds depending on the phase of the menstrual cycle. Comparing Your Results In this section of the activity, you will use the following Tatles 4 through 9 to determine where you are situated in relation to the averages for adult males and females in thermoregulation and tolerance tests. Ater you huve reviewed the data tablex answer the set of related questions. TAELE 4. Fenale Dasa for Hear Themonguation Test TAgLE S. Maie Dass for Meat Thermoregulation Test TABLE 6. Fomale Data for Cold Tolenance Teat (Resting Stube] TABLE 7: Molo Data for Cold Tolecance Test (Reesing stane) TABLE \& Female Diat for Cold Tolerance Test (Adtive Stute) TABLE 7; Male Data for Cold Tolerance Test (Resting State) TABLE 8: Female Data for Cold Tolerance Test (Active State) TABLE 9: Male Data for Cold Tolerance Test (Active State) Part 3 Questions: 6. In the data for BMI and time to sweat (Tables 4 and 5), are there any discermible patterns present in the results for males and females? (If you do see a pattern, briefly explain what you think may be the cause. If you do not see a pattern, briefly explain what you think might cause the results to be so similar.) 7. In the data for BMI and time in ice (resting vs. active) (Tables . through 9), are there any discernible patterns present in the results for males and females? (If you do see a pattern, briefly explain what you think may be the cause. If you do not see a pattern, briefly explain what you think might catse the results to be so similar.) 8. When comparing your results with the averages and standard deviations presented in Tables 4 through 9 , think about how well your responded to the heat and cold stress. In two or three sentences, describe how well you compare with the ranges of normal human variation in adaptive response to heat and cold stress for your biological sex and BML. 9. After comparing your results with the averages shown in Tables 4 through 9 , does your answer to Question 5 in Part 2 remain the same or have your results changed your opinion on whether you are heat or cold acclimated? Briefly explain your answer using information from your results and the tabled data