

Answered step by step
Verified Expert Solution
Question
1 Approved Answer
Table 4-4 Moderately Large Corporation Consolidated Balance Sheet Moderately Large Corporation Consolidaed Balance Sheet (in thousands except share data) Fiscal Year Ended Dec 31, 2013
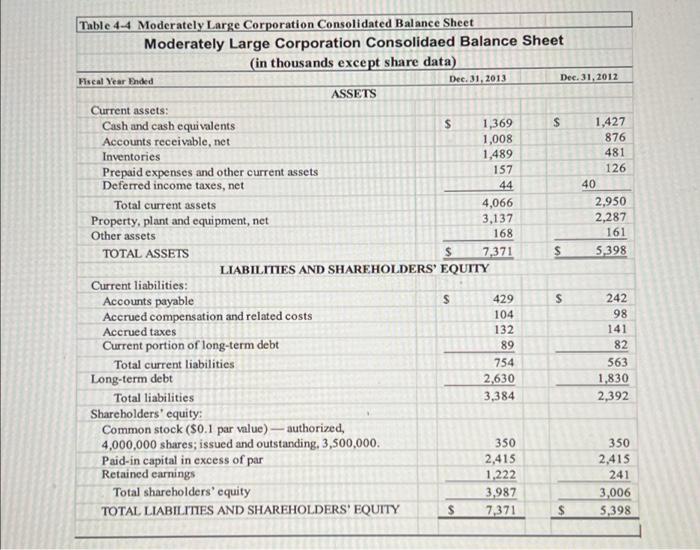
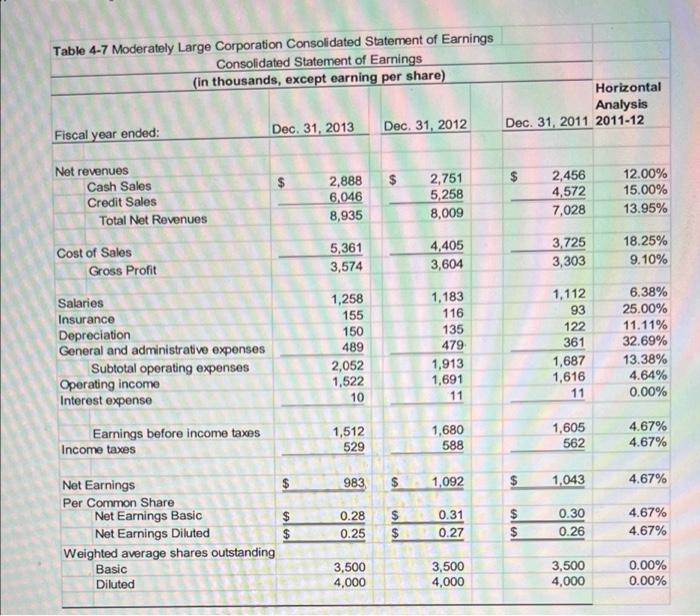
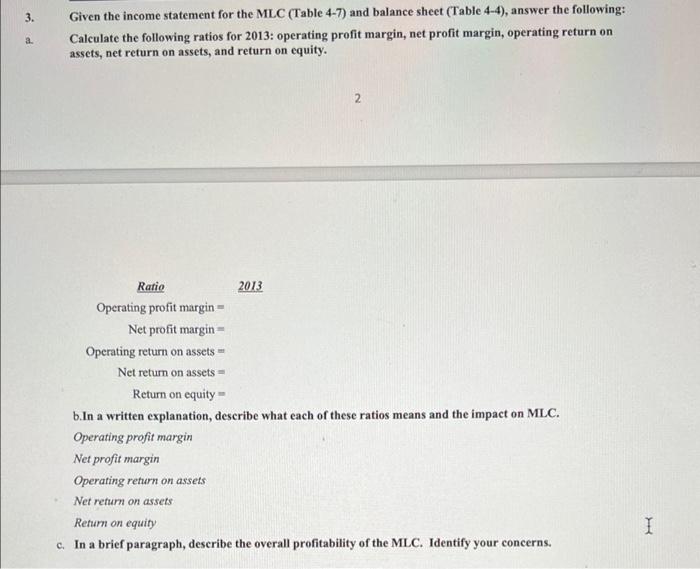 Table 4-4 Moderately Large Corporation Consolidated Balance Sheet Moderately Large Corporation Consolidaed Balance Sheet (in thousands except share data) Fiscal Year Ended Dec 31, 2013 Dec 31, 2012 ASSETS Current assets: Cash and cash equivalents $ 1,369 s 1,427 Accounts receivable, net 1,008 876 Inventories 1,489 481 Prepaid expenses and other current assets 157 126 Deferred income taxes, net 44 40 Total current assets 4,066 2,950 Property, plant and equipment, net 3,137 2,287 Other assets 168 161 TOTAL ASSETS $ 7,371 S 5.398 LIABILITIES AND SHAREHOLDERS' EQUITY Current liabilities: Accounts payable s 429 242 Accrued compensation and related costs 104 98 Accrued taxes 132 141 Current portion of long-term debt 89 82 Total current liabilities 754 563 Long-term debt 2,630 1,830 Total liabilities 3,384 2,392 Shareholders' equity: Common stock ($0.1 par value) - authorized, 4,000,000 shares; issued and outstanding. 3,500,000. 350 350 Paid-in capital in excess of par 2,415 2,415 Retained earnings 1.222 241 Total shareholders' equity 3,987 3,006 TOTAL LIABILITIES AND SHAREHOLDERS' EQUITY S 7,371 $ 5,398 s Table 4-7 Moderately Large Corporation Consolidated Statement of Earnings Consolidated Statement of Earnings (in thousands, except earning per share) Horizontal Analysis Dec. 31, 2011 2011-12 Dec 31, 2013 Dec 31, 2012 Fiscal year ended $ $ $ Net revenues Cash Sales Credit Sales Total Net Revenues 2,888 6,046 8,935 2,751 5,258 8,009 2,456 4,572 7,028 12.00% 15.00% 13.95% Cost of Sales Gross Profit 5,361 3,574 4,405 3,604 3,725 3,303 18.25% 9.10% Salaries Insurance Depreciation General and administrative expenses Subtotal operating expenses Operating income Interest expense 1,258 155 150 489 2,052 1,522 10 1,183 116 135 479 1,913 1,691 11 1,112 93 122 361 1,687 1,616 11 6.38% 25.00% 11.11% 32.69% 13.38% 4.64% 0.00% Earnings before income taxes Income taxes 1,512 529 1,680 588 1,605 562 4.67% 4.67% $ 983 $ 1,092 $ 1,043 4.67% Net Earnings Per Common Share Net Earnings Basic Net Earnings Diluted Weighted average shares outstanding Basic Diluted 0.28 0.25 $ $ 0.31 0.27 lul $ $ 0.30 0.26 4.67% 4.67% $ 3,500 4,000 3,500 4,000 3,500 4,000 0.00% 0.00% 3. a Given the income statement for the MLC (Table 4-7) and balance sheet (Table 4-4), answer the following: Calculate the following ratios for 2013: operating profit margin, net profit margin, operating return on assets, net return on assets, and return on equity. 2 Ratio 2013 Operating profit margin- Net profit margin= Operating return on assets - Net return on assets - Return on equity - b.In a written explanation, describe what each of these ratios means and the impact on MLC. Operating profit margin Net profit margin Operating return on assets Net return on assets Return on equity c. In a brief paragraph, describe the overall profitability of the MLC. Identify your concerns
Step by Step Solution
There are 3 Steps involved in it
Step: 1

Get Instant Access to Expert-Tailored Solutions
See step-by-step solutions with expert insights and AI powered tools for academic success
Step: 2

Step: 3
Ace Your Homework with AI
Get the answers you need in no time with our AI-driven, step-by-step assistance
Get Started
The Nft Guide Learn How To Buy Sell Collect And Mint Non Fungible Tokens
Authors: Thomas Jase
1st Edition