Question
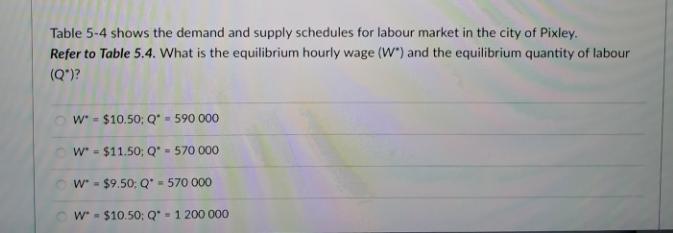
Table 5-4 shows the demand and supply schedules for labour market in the city of Pixley. Refer to Table 5.4. What is the equilibrium


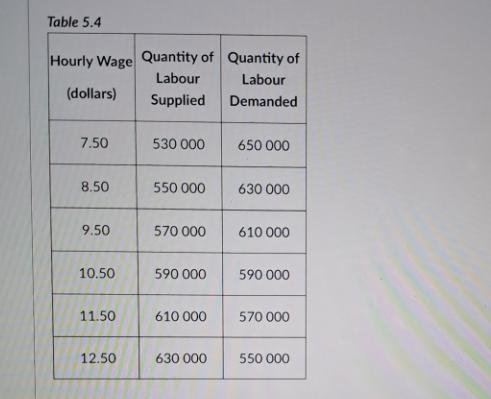
Table 5-4 shows the demand and supply schedules for labour market in the city of Pixley. Refer to Table 5.4. What is the equilibrium hourly wage (W") and the equilibrium quantity of labour (Q*)? W*- $10.50; Q* - 590 000 W*- $11.50; Q* - 570 000 W $9.50: Q =570 000 W - $10.50: Q - 1 200 000 Table 5.4 Hourly Wage Quantity of Quantity of Labour Labour (dollars) Supplied Demanded 7.50 8.50 9.50 10.50 11.50 12.50 530 000 550 000 570 000 590 000 610 000 630 000 650 000 630 000 610 000 590 000 570 000 550 000
Step by Step Solution
There are 3 Steps involved in it
Step: 1
The detailed answer for the above question is provided belo...
Get Instant Access to Expert-Tailored Solutions
See step-by-step solutions with expert insights and AI powered tools for academic success
Step: 2

Step: 3

Ace Your Homework with AI
Get the answers you need in no time with our AI-driven, step-by-step assistance
Get StartedRecommended Textbook for
Microeconomics
Authors: Paul Krugman, Robin Wells
3rd edition
978-1429283427, 1429283424, 978-1464104213, 1464104212, 978-1429283434
Students also viewed these Economics questions
Question
Answered: 1 week ago
Question
Answered: 1 week ago
Question
Answered: 1 week ago
Question
Answered: 1 week ago
Question
Answered: 1 week ago
Question
Answered: 1 week ago
Question
Answered: 1 week ago
Question
Answered: 1 week ago
Question
Answered: 1 week ago
Question
Answered: 1 week ago
Question
Answered: 1 week ago
Question
Answered: 1 week ago
Question
Answered: 1 week ago
Question
Answered: 1 week ago
Question
Answered: 1 week ago
Question
Answered: 1 week ago
Question
Answered: 1 week ago
Question
Answered: 1 week ago
Question
Answered: 1 week ago
Question
Answered: 1 week ago
Question
Answered: 1 week ago
Question
Answered: 1 week ago
View Answer in SolutionInn App


