Question
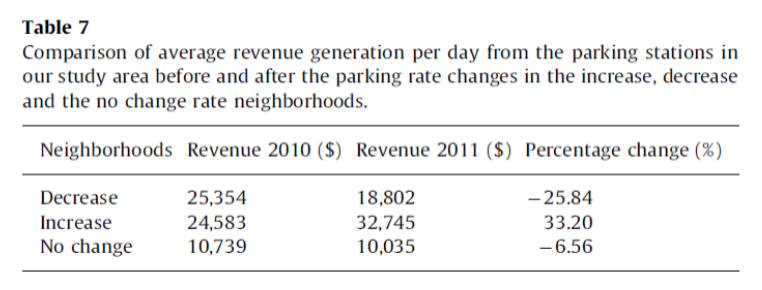
Table 7 Comparison of average revenue generation per day from the parking stations in our study area before and after the parking rate changes

Table 7 Comparison of average revenue generation per day from the parking stations in our study area before and after the parking rate changes in the increase, decrease and the no change rate neighborhoods. Neighborhoods Revenue 2010 ($) Revenue 2011 ($) Percentage change (%) Decrease 25,354 18,802 -25.84 Increase 24,583 32,745 33.20 No change 10,739 10,035 -6.56
Step by Step Solution
There are 3 Steps involved in it
Step: 1
Based on the provided data we can observe the changes in average revenue generation per day from the parking stations in the study area before 2010 an...
Get Instant Access to Expert-Tailored Solutions
See step-by-step solutions with expert insights and AI powered tools for academic success
Step: 2

Step: 3

Ace Your Homework with AI
Get the answers you need in no time with our AI-driven, step-by-step assistance
Get StartedRecommended Textbook for
Financial Management for Public Health and Not for Profit Organizations
Authors: Steven A. Finkler, Thad Calabrese
4th edition
133060411, 132805669, 9780133060416, 978-0132805667
Students also viewed these Economics questions
Question
Answered: 1 week ago
Question
Answered: 1 week ago
Question
Answered: 1 week ago
Question
Answered: 1 week ago
Question
Answered: 1 week ago
Question
Answered: 1 week ago
Question
Answered: 1 week ago
Question
Answered: 1 week ago
Question
Answered: 1 week ago
Question
Answered: 1 week ago
Question
Answered: 1 week ago
Question
Answered: 1 week ago
Question
Answered: 1 week ago
Question
Answered: 1 week ago
Question
Answered: 1 week ago
Question
Answered: 1 week ago
Question
Answered: 1 week ago
Question
Answered: 1 week ago
Question
Answered: 1 week ago
Question
Answered: 1 week ago
Question
Answered: 1 week ago
View Answer in SolutionInn App


