

Answered step by step
Verified Expert Solution
Question
1 Approved Answer
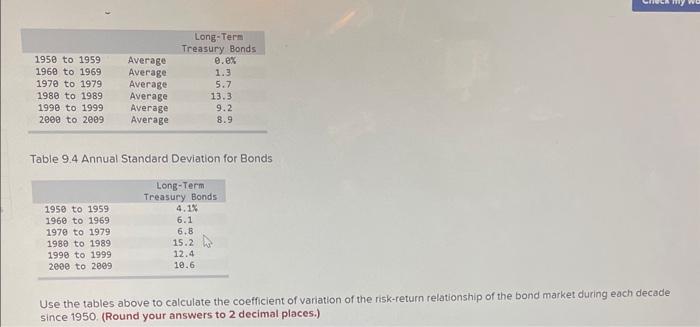
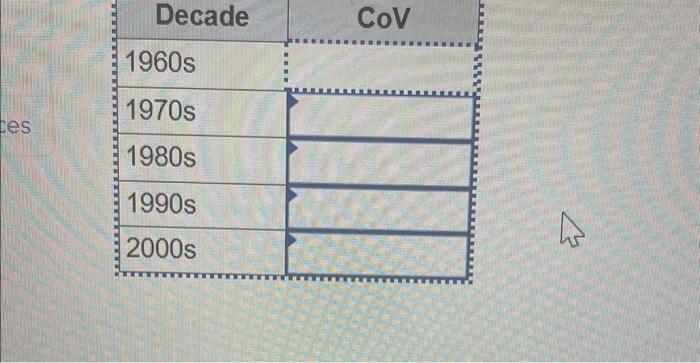
Table 9.4 Annual Standard Deviation for Bonds Use the tables above to calculate the coefficient of variation of the risk-return relationship of the bond market
Step by Step Solution
There are 3 Steps involved in it
Step: 1

Get Instant Access to Expert-Tailored Solutions
See step-by-step solutions with expert insights and AI powered tools for academic success
Step: 2

Step: 3
Ace Your Homework with AI
Get the answers you need in no time with our AI-driven, step-by-step assistance
Get Started
Financial Data Analytics Theory And Application
Authors: Sinem Derindere Köseo?lu
1st Edition
303083798X,3030837998