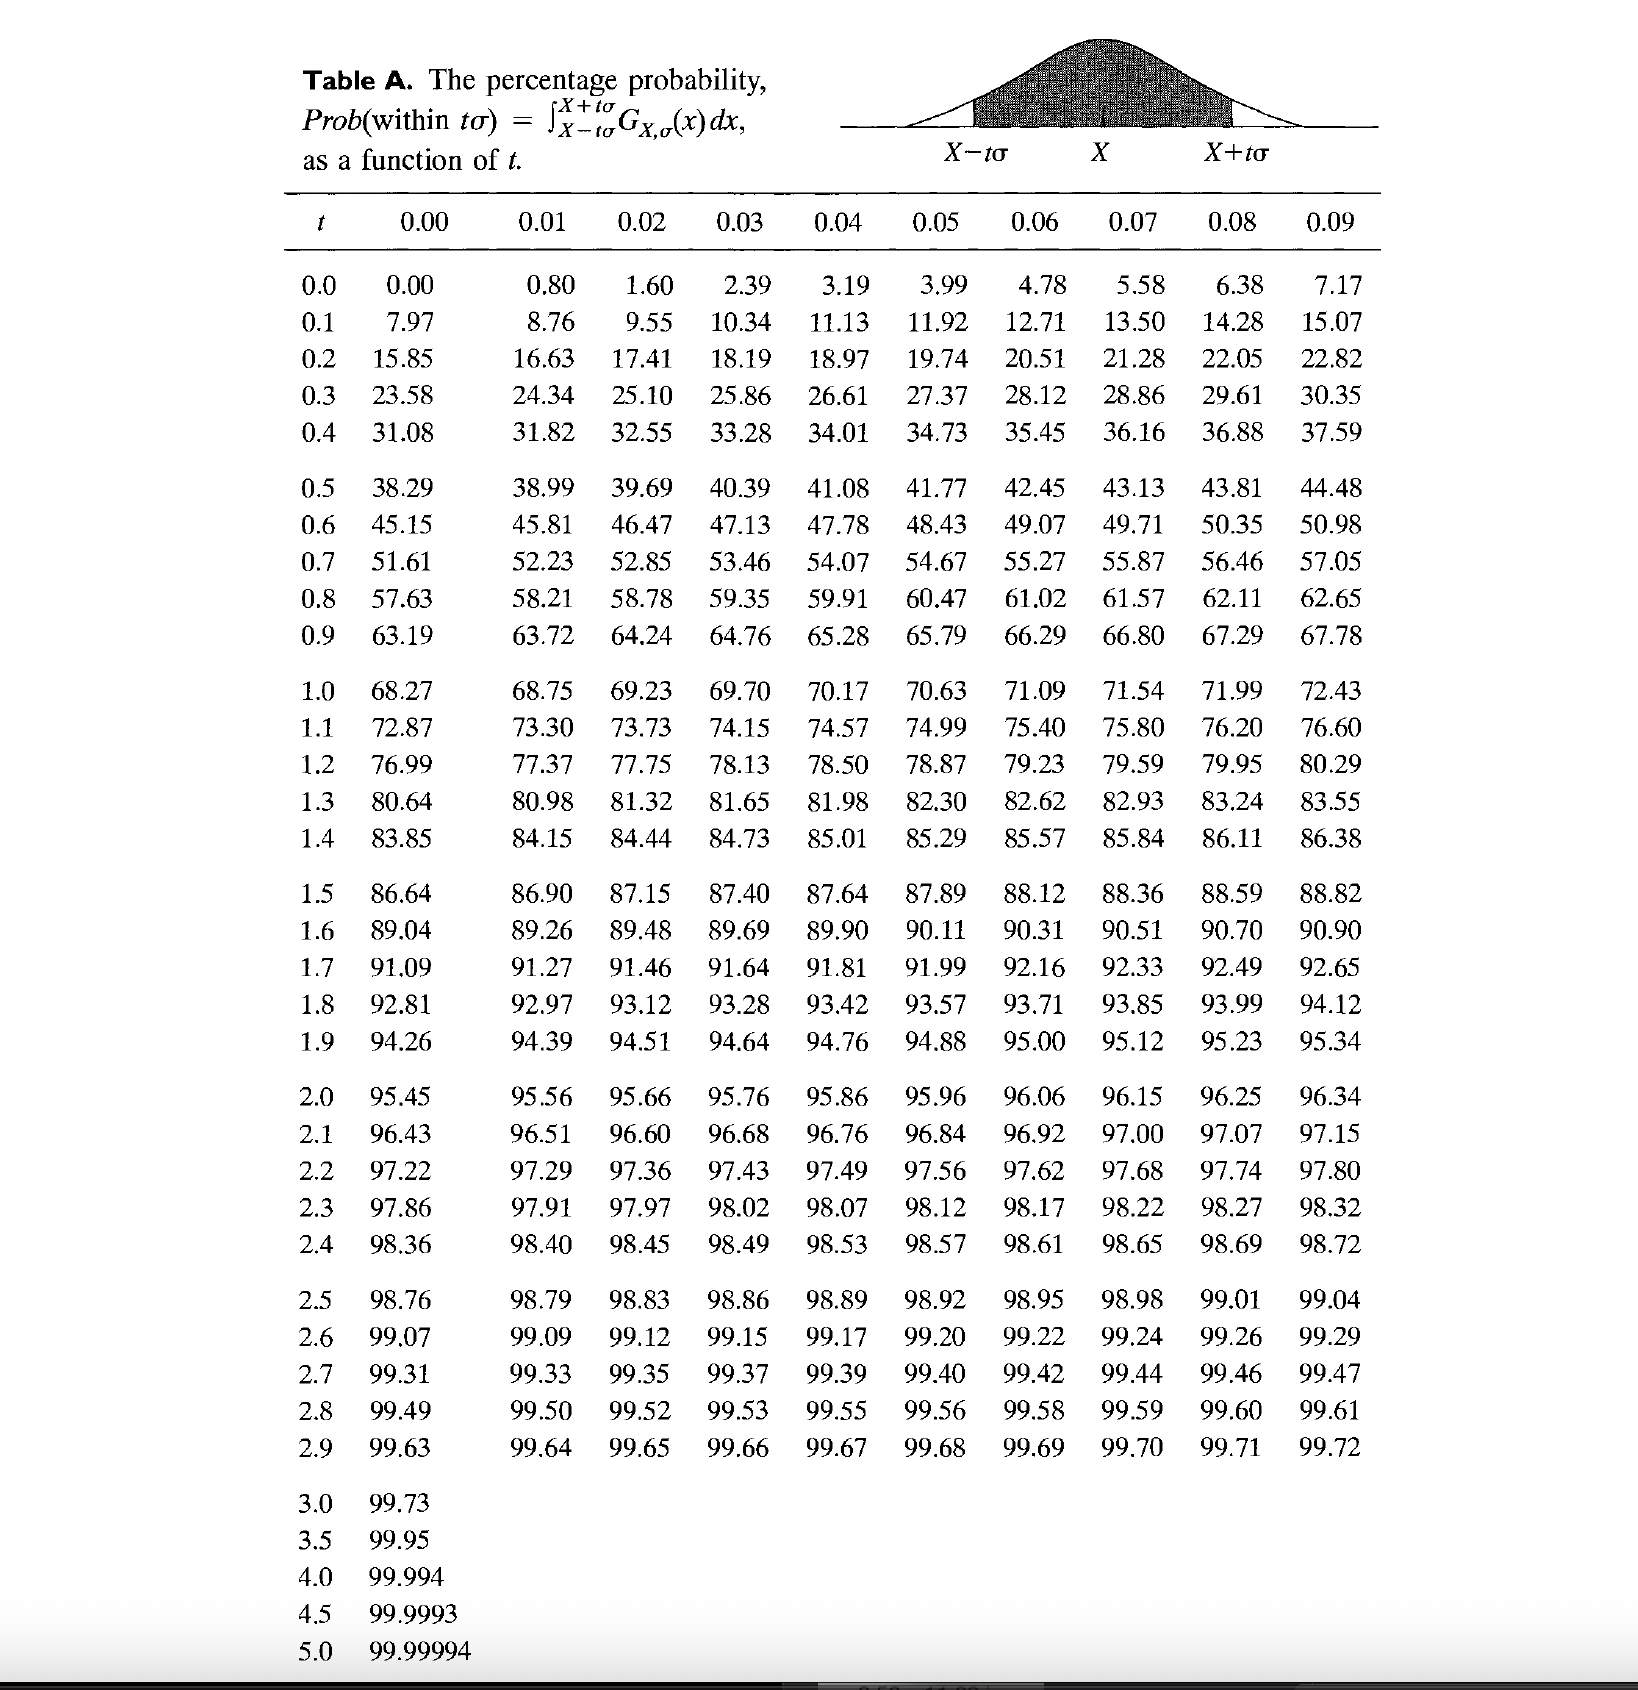
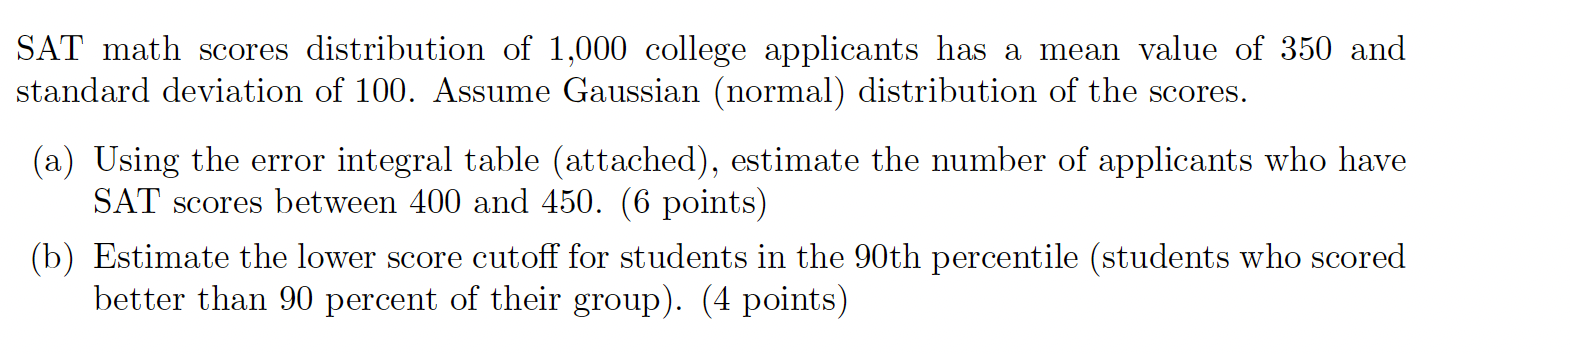
Table A. The percentage probability, Prob(within to) = fatto JX - to Gx,o(x) dx, X-to X X+to as a function of t. 0.08 0.09 0.00 0.01 0.02 0.03 0.04 0.05 0.06 0.07 0.0 0.00 0.80 1.60 2.39 3.19 3.99 4.78 5.58 6.38 7.17 0.1 7.97 8.76 9.55 10.34 11.13 11.92 12.71 13.50 14.28 15.07 0.2 15.85 16.63 17.41 18.19 18.97 19.74 20.51 21.28 22.05 22.82 0.3 23.58 24.34 25.10 25.86 26.61 27.37 28.12 28.86 29.61 30.35 0.4 31.08 31.82 32.55 33.28 34.01 34.73 35.45 36.16 36.88 37.59 0.5 38.29 38.99 39.69 40.39 41.08 41.77 42.45 43.13 43.81 44.48 45.15 45.81 46.47 47.13 47.78 48.43 49.07 49.71 50.35 50.98 0.6 51.61 52.23 52.85 53.46 54.07 54.67 55.27 55.87 56.46 57.05 0.7 57.63 58.78 59.35 59.91 60.47 62.11 0.8 58.21 61.02 61.57 62.65 0.9 63.19 63.72 64.24 64.76 65.28 65.79 66.29 66.80 67.29 67.78 71.54 71.99 72.43 1.0 68.27 68.75 69.23 69.70 70.17 70.63 71.09 76.20 76.60 1.1 72.87 73.30 73.73 74.15 74.57 74.99 75.40 75.80 77.37 77.75 78.13 78.50 78.87 79.23 79.59 79.95 80.29 1.2 76.99 80.98 81.32 81.65 81.98 82.30 82.62 82.93 83.24 83.55 1.3 80.64 1.4 83.85 84.15 84.44 84.73 85.01 85.29 85.57 85.84 86.11 86.38 1.5 86.64 86.90 87.15 87.40 87.64 87.89 88.12 88.36 88.59 88.82 1.6 89.04 89.26 89.48 89.69 89.90 90.11 90.31 90.51 90.70 90.90 91.09 91.27 91.46 91.64 91.81 91.99 92.16 92.33 92.49 92.65 1.7 92.81 92.97 93.12 93.28 93.42 93.57 93.71 93.85 93.99 94.12 1.8 1.9 94.26 94.39 94.51 94.64 94.76 94.88 95.00 95.12 95.23 95.34 95.56 95.66 95.76 95.86 95.96 96.06 96.15 96.25 96.34 2.0 95.45 2.1 96.43 96.51 96.60 96.68 96.76 96.84 96.92 97.00 97.07 97.15 2.2 97.22 97.29 97.36 97.43 97.49 97.56 97.62 97.68 97.74 97.80 2.3 97.86 7.91 97.97 98.02 98.07 98.12 98.17 98.22 98.27 98.32 2.4 98.36 98.40 98.45 98.49 98.53 98.57 98.61 98.65 98.69 98.72 98.89 98.92 98.98 99.01 2.5 98.86 99.04 98.76 98.79 98.83 98.95 2.6 99.07 99.09 99.12 99.15 99.17 99.20 99.22 99.24 99.26 99.29 99.33 99 35 99.37 99.39 99 40 99.42 99.44 99.46 99.47 2.7 99.31 99.61 2.8 99.49 99.50 99.52 99.53 99.55 99.56 99.58 99.59 99.60 2.9 99.63 99.64 99.65 99.66 99.67 99.68 99.69 99.70 99.71 99.72 3.0 99.73 3.5 99 95 4.0 99.994 4.5 99.9993 5.0 99.99994SAT math scores distribution of 1,000 college applicants has a mean value of 350 and standard deviation of 100. Assume Gaussian (normal) distribution of the scores. (a) Using the error integral table (attached), estimate the number of applicants who have SAT scores between 400 and 450. (6 points) (b) Estimate the lower score cutoff for students in the 90th percentile (students who scored better than 90 percent of their group). (4 points)