Answered step by step
Verified Expert Solution
Question
1 Approved Answer
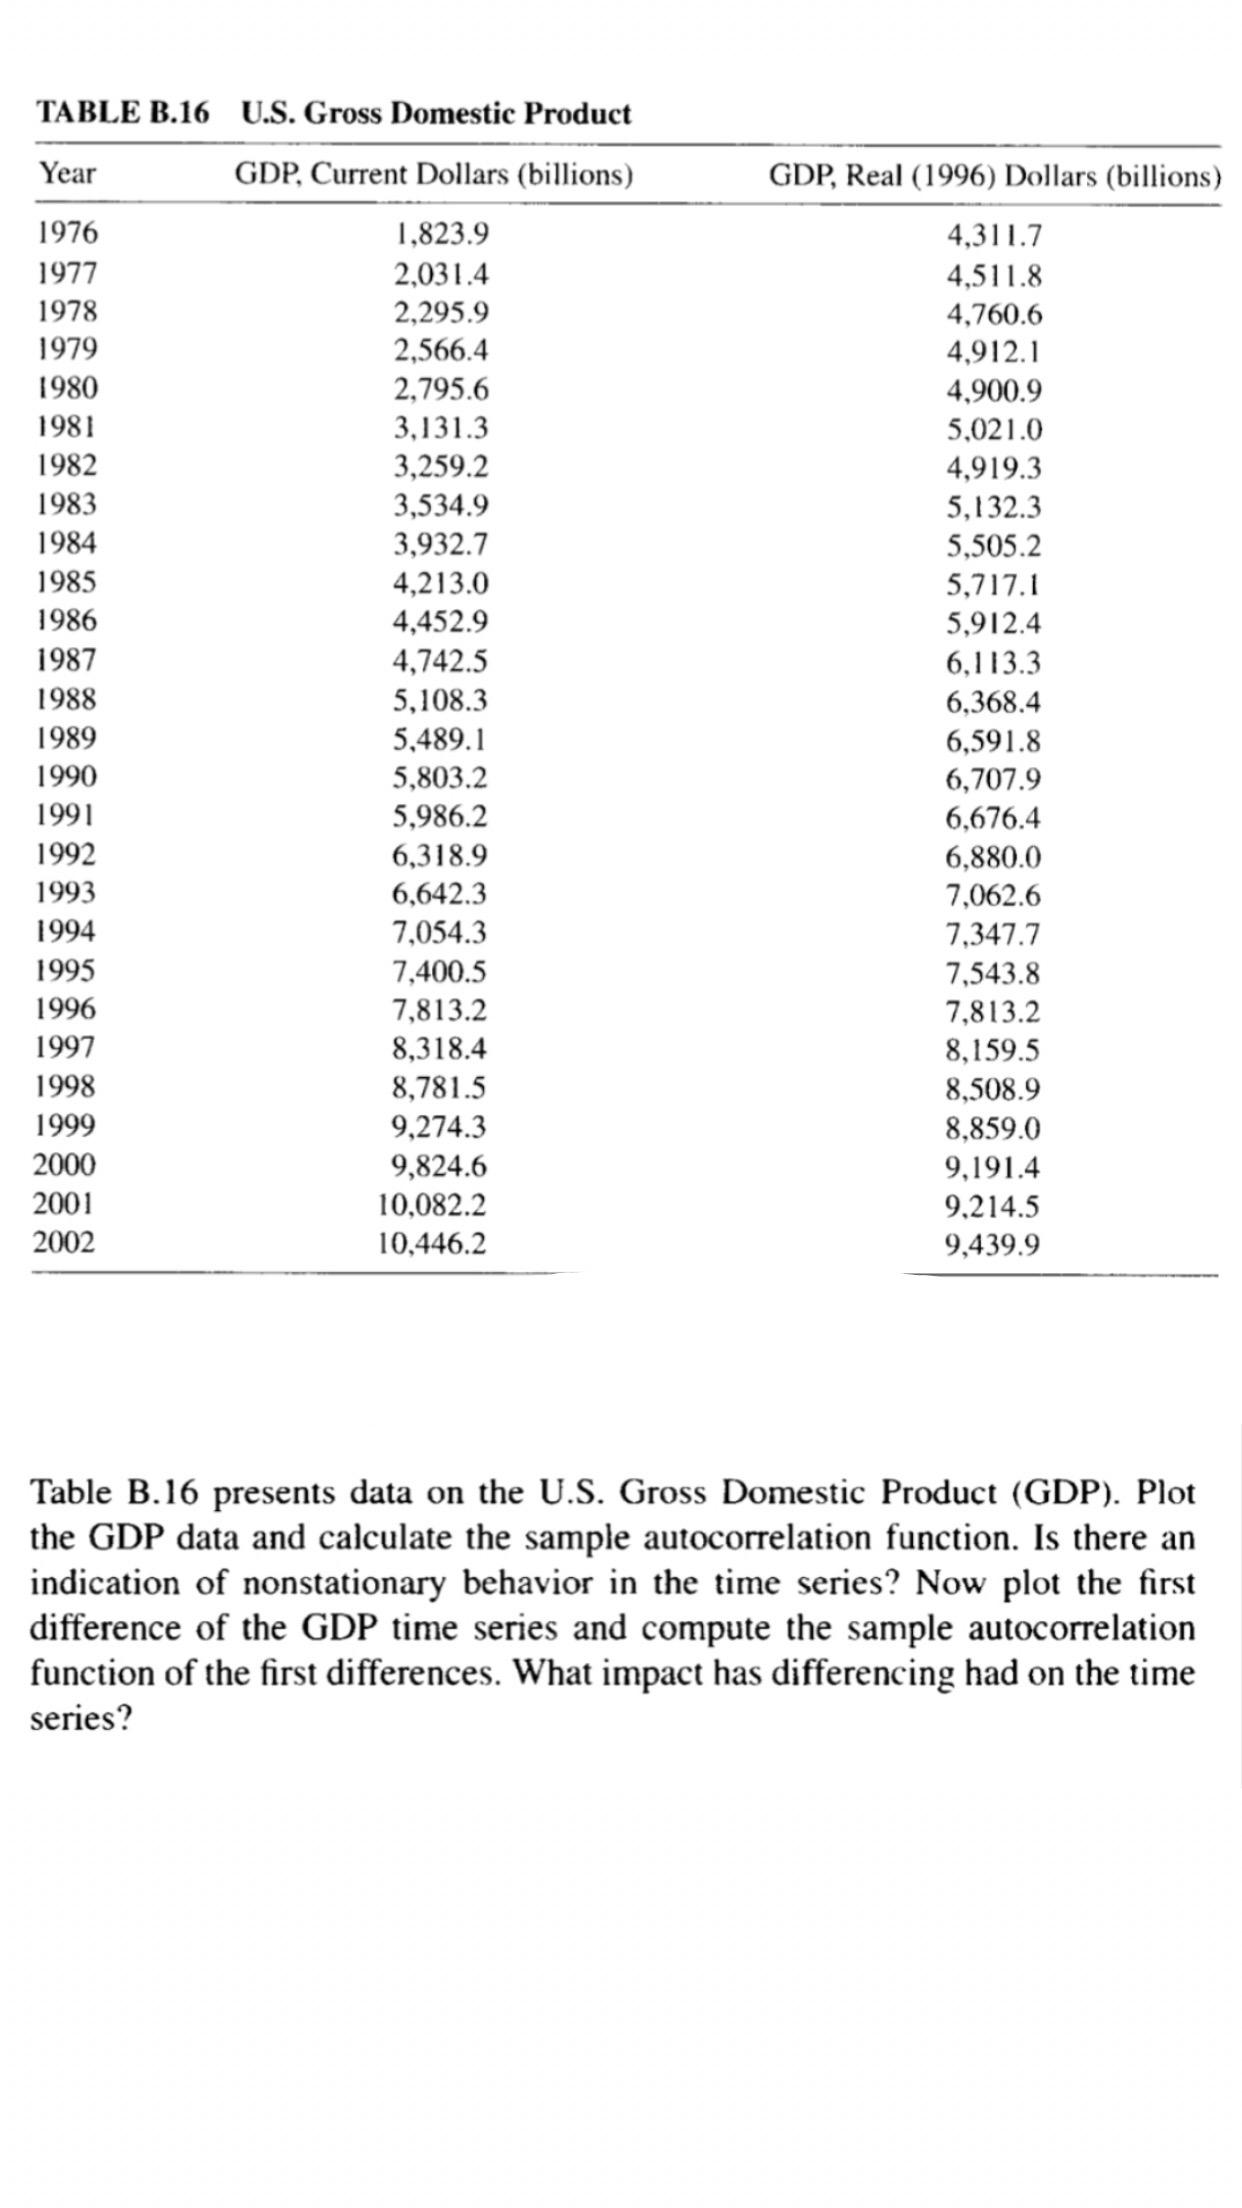
TABLE B.16 U.S. Gross Domestic Product Year GDP, Current Dollars (billions) GDP, Real (1996) Dollars (billions) 1976 1,823.9 4,311.7 1977 2,031.4 4,511.8 1978 2,295.9

TABLE B.16 U.S. Gross Domestic Product Year GDP, Current Dollars (billions) GDP, Real (1996) Dollars (billions) 1976 1,823.9 4,311.7 1977 2,031.4 4,511.8 1978 2,295.9 4,760.6 1979 2,566.4 4,912.1 1980 2,795.6 4,900.9 1981 3,131.3 5,021.0 1982 3,259.2 3,534.9 4,919.3 1983 5,132.3 1984 3,932.7 5,505.2 1985 4,213.0 5,717.1 1986 4,452.9 5,912.4 1987 4,742.5 6,113.3 1988 5,108.3 6,368.4 1989 5,489.1 6,591.8 1990 5,803.2 6,707.9 1991 5,986.2 6,676.4 1992 6,318.9 6,880.0 7,062.6 1993 6,642.3 1994 7,054.3 7,347.7 1995 7,400.5 7,813.2 7,543.8 1996 7,813.2 1997 8,318.4 8,159.5 1998 8,781.5 8,508.9 1999 9,274.3 8,859.0 2000 9,824.6 10,082.2 9,191.4 2001 9,214.5 2002 10,446.2 9,439.9 Table B.16 presents data on the U.S. Gross Domestic Product (GDP). Plot the GDP data and calculate the sample autocorrelation function. Is there an indication of nonstationary behavior in the time series? Now plot the first difference of the GDP time series and compute the sample autocorrelation function of the first differences. What impact has differencing had on the time series?
Step by Step Solution
★★★★★
3.48 Rating (151 Votes )
There are 3 Steps involved in it
Step: 1
The mean and the variance of a stationary series do not change over time nor do they follow a trend ...
Get Instant Access to Expert-Tailored Solutions
See step-by-step solutions with expert insights and AI powered tools for academic success
Step: 2

Step: 3

Ace Your Homework with AI
Get the answers you need in no time with our AI-driven, step-by-step assistance
Get Started


